Whole Slide Images (WSI)
Large histopathlogy images such as H & E stains can be visualized in rakaia v0.23.0 and later alongside multiplexed image blends from both antibody-based assays and spatial assays. depending on the source of the multiplexed blend in the current session, rakaia may also be able to align the WSI coordinates to the current blend (currently this applies only to 10X assays such as Visium and Xenium).
WSI rendering requirements
Viewing WSIs in rakaia requires an installation of libvips; without a standalone vips installation, rakaia will inform the user that WSIs cannot be processed and rendered with openseadragon. Users should fetch the relevant vips installation for their OS from the installation page, as this library is not shipped/installed in rakaia by default.
WSI viewer tab
WSIs are viewed in a separate tab from the multiplexed blend; this can be toggled by switching between the Canvas and WSI sub tabs in the main canvas page:
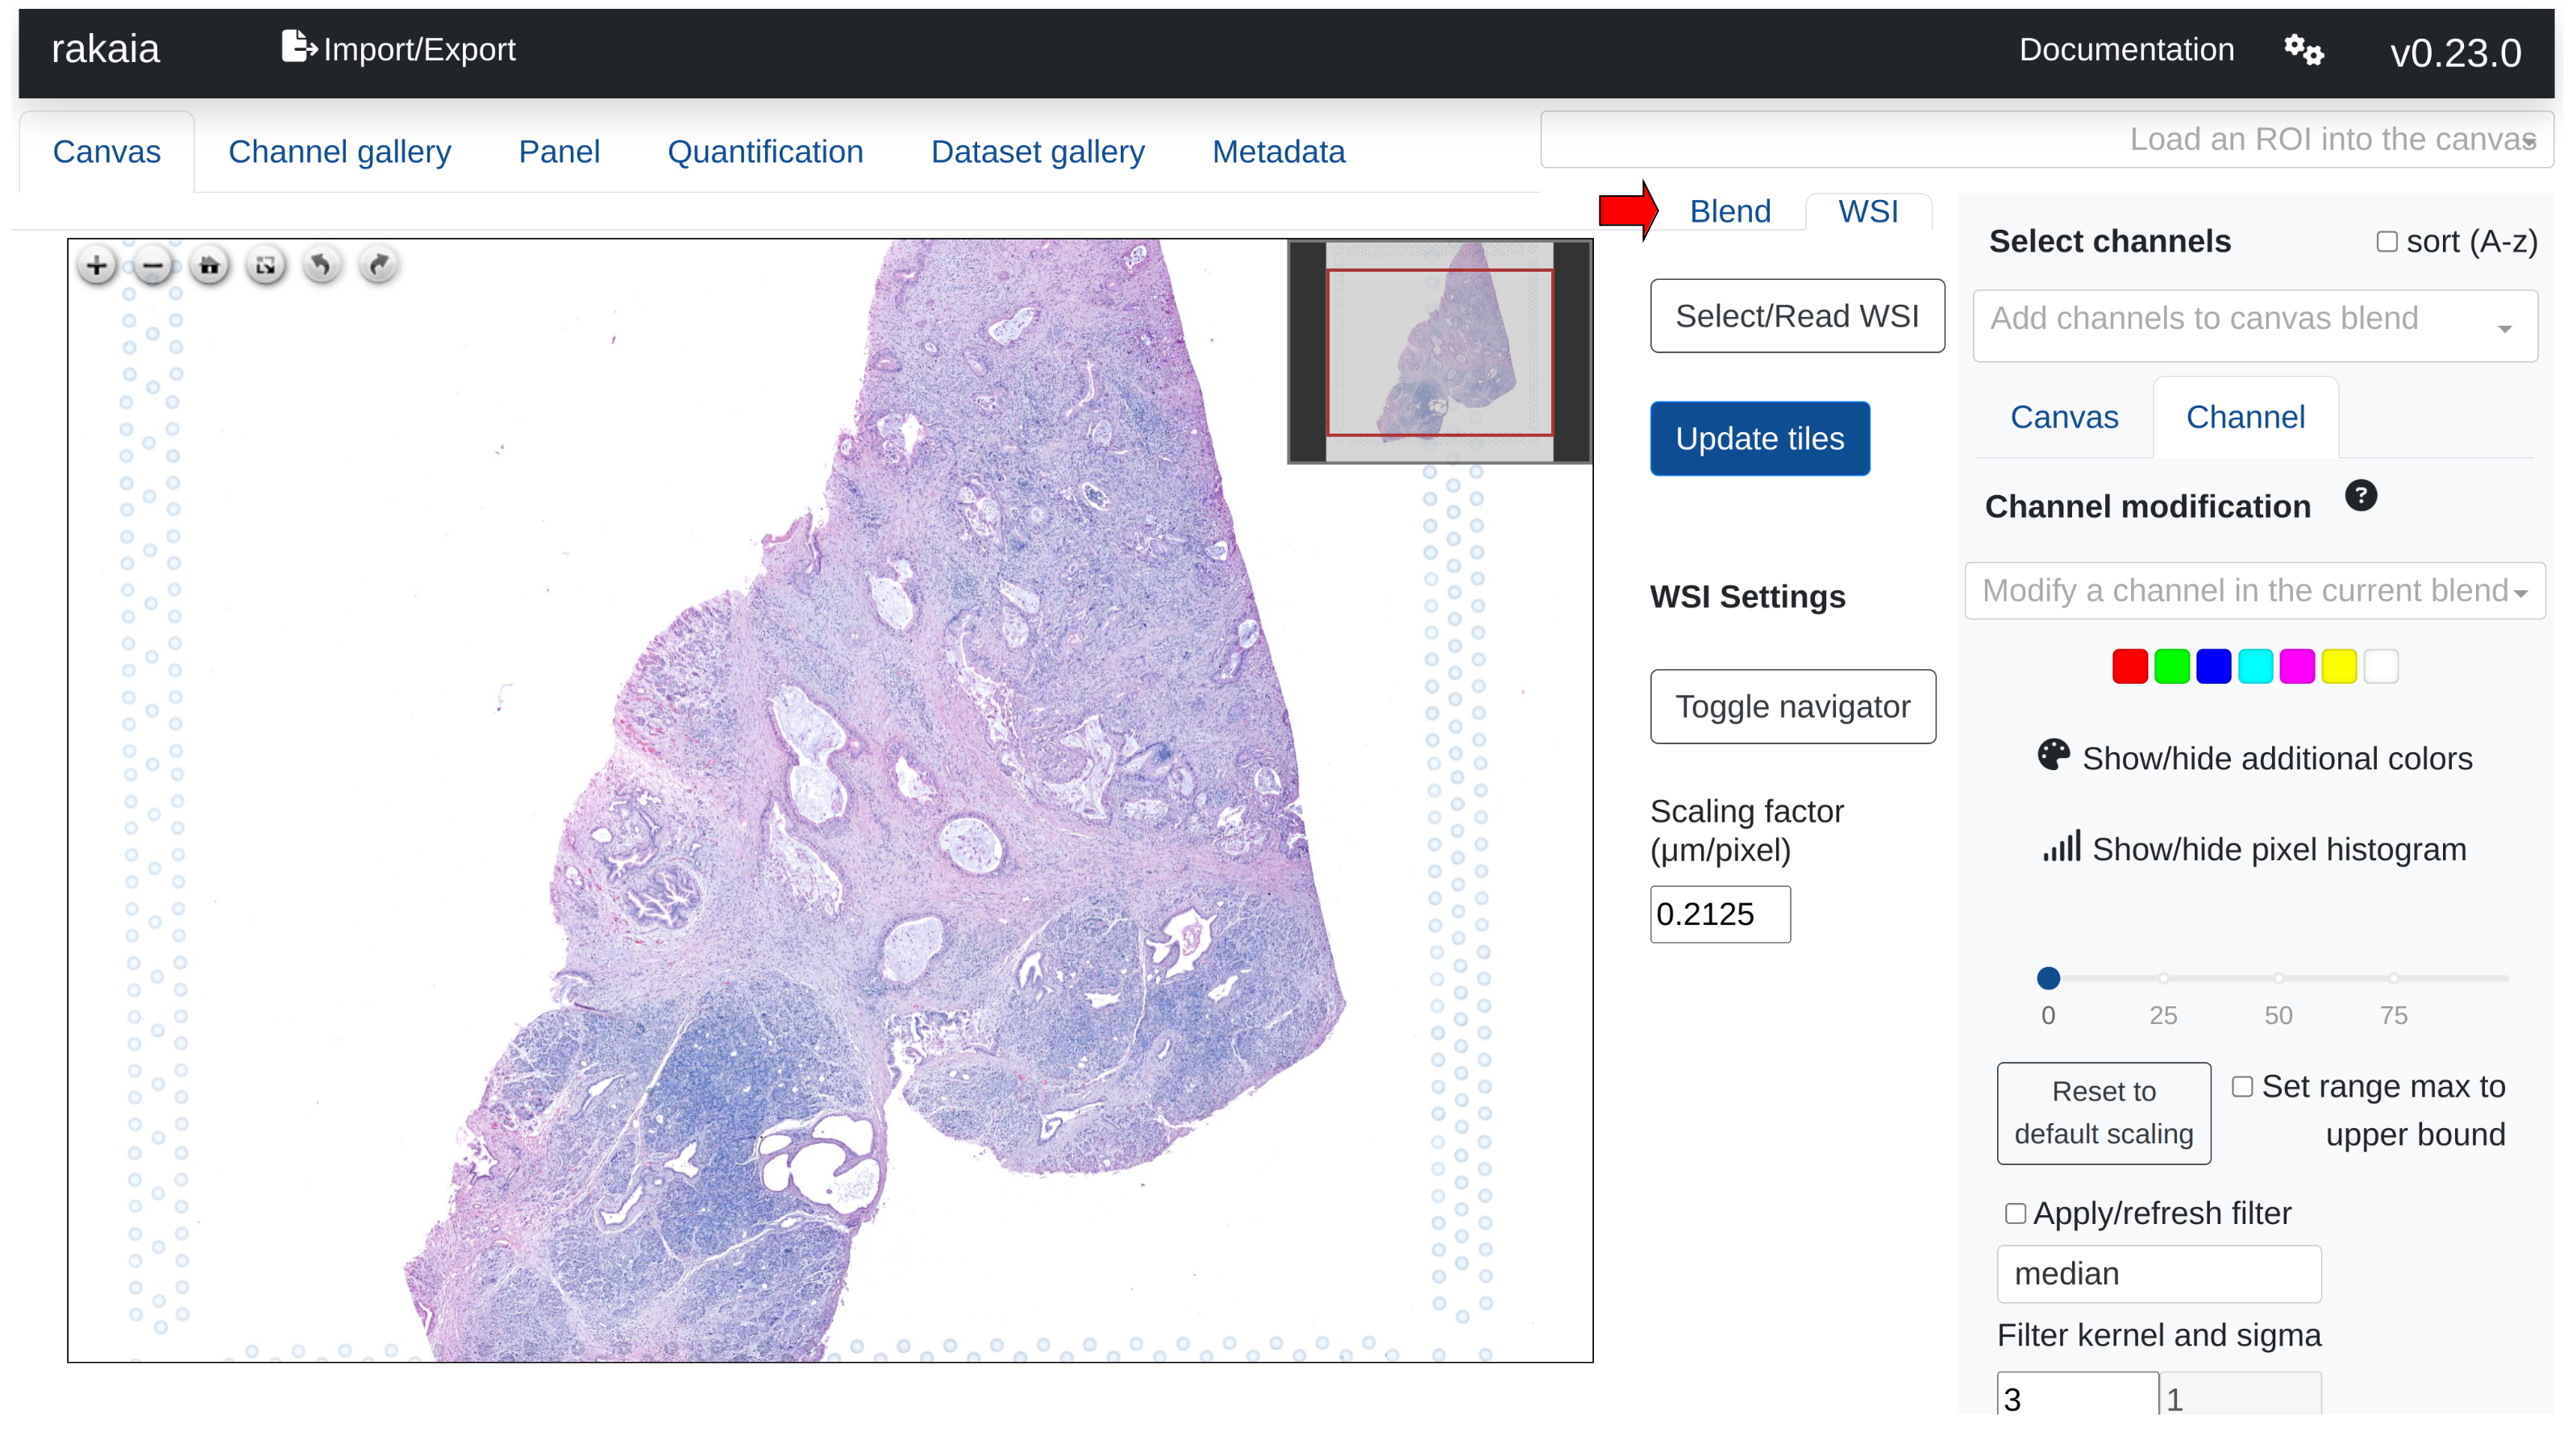
Users can import WSIs using either a direct file path import under Select/Read WSI from the tab as shown above, or through drag and drop under the Import/Export side tab, Show/hide additional imports -> Choose or drop WSI.
rakaia currently supports the following image formats that are converted in dzi tiles for rendering:
- tiff (pyramidal)
- svs
- btf (big TIFF)
- ndpi (Hamamatsu)
- scn (Leica)
- jpg/jpeg (lossy compressed)
Users can switch the WSI loaded into the WSI viewer using the Select/Read WSI -> Select WSI dropdown. Once a selection is made, a loader will start indicating that the dzi tiles for the selected WSI are being generated. For rakaia v0.27.0 or earlier, once finished, users should select Update tiles to finish rendering the WSI in the viewer.
For older versions of rakaia (0.27.0 and earlier), users must explicitly press Update tiles to regenerate new WSI tiles on image selection. For newer versions (0.28.0 and later), tiles will update automatically on change. However, to ensure that users can always sync to up-to-date tiles, Update tiles can always be used to ensure that the corresponding tiles for the latest WSI are rendered.
openseadragon (osd) viewer
Viewing WSIs is supported by openseadragon, a Javascript library designed to render high-resolution, zoomable images. The viewer enables zooming, panning, and full-screen views of WSIs. Visit the osd documentation for more information.
osd Controls
Users can manually specify the zoom level on a rendered WSI in rakaia v0.29.0 or later:
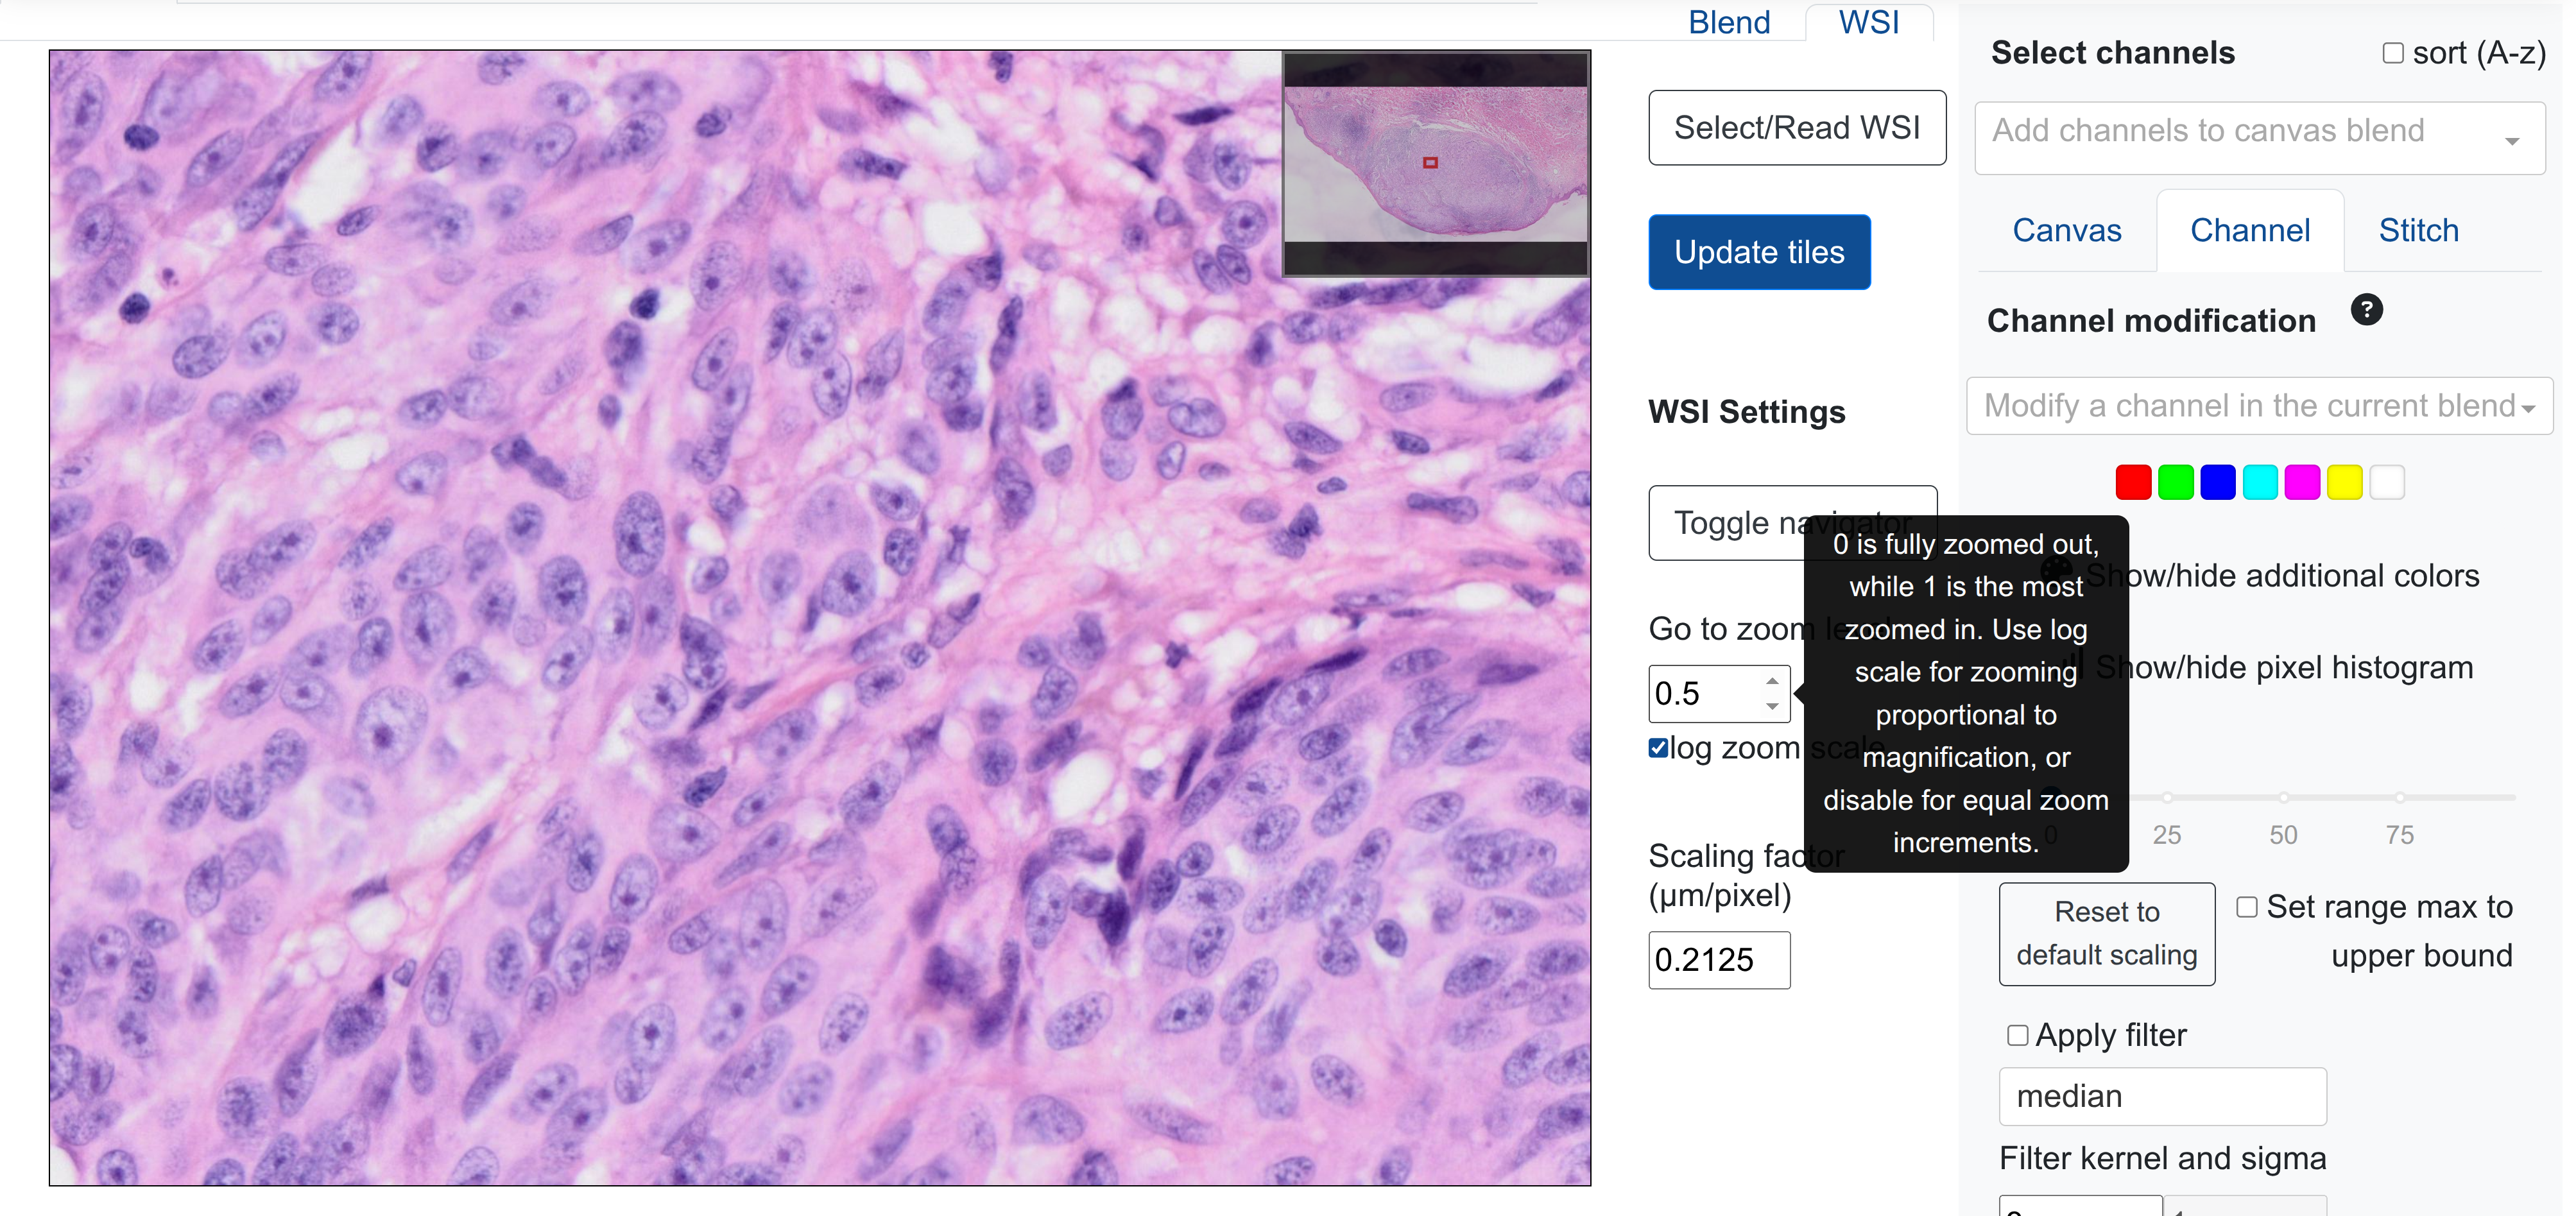
Values can be specified between 0 (fully zoomed out/home) to 1 (most zoomed in, depending on resolution).
Selecting log zoom scale will cause the value increments to mimic magnification levels in a WSI (10, 20, 40x etc.), whereas disabling this will have the increments evenly distributed. For example, for a 40x WSI, a zoom level of 0.5 will zoom in a lot more with the log scale activated as opposed to without.
This feature is most effective when starting from the "home" setting (top-level of the WSI with no zoom used. This can be reached by pressing the HOME icon in the osd view). Note that the zoom level is changed when using tracked zooming and panning (shown below with aligned WSIs to the canvas).
Aligned WSIs to the multiplexed canvas
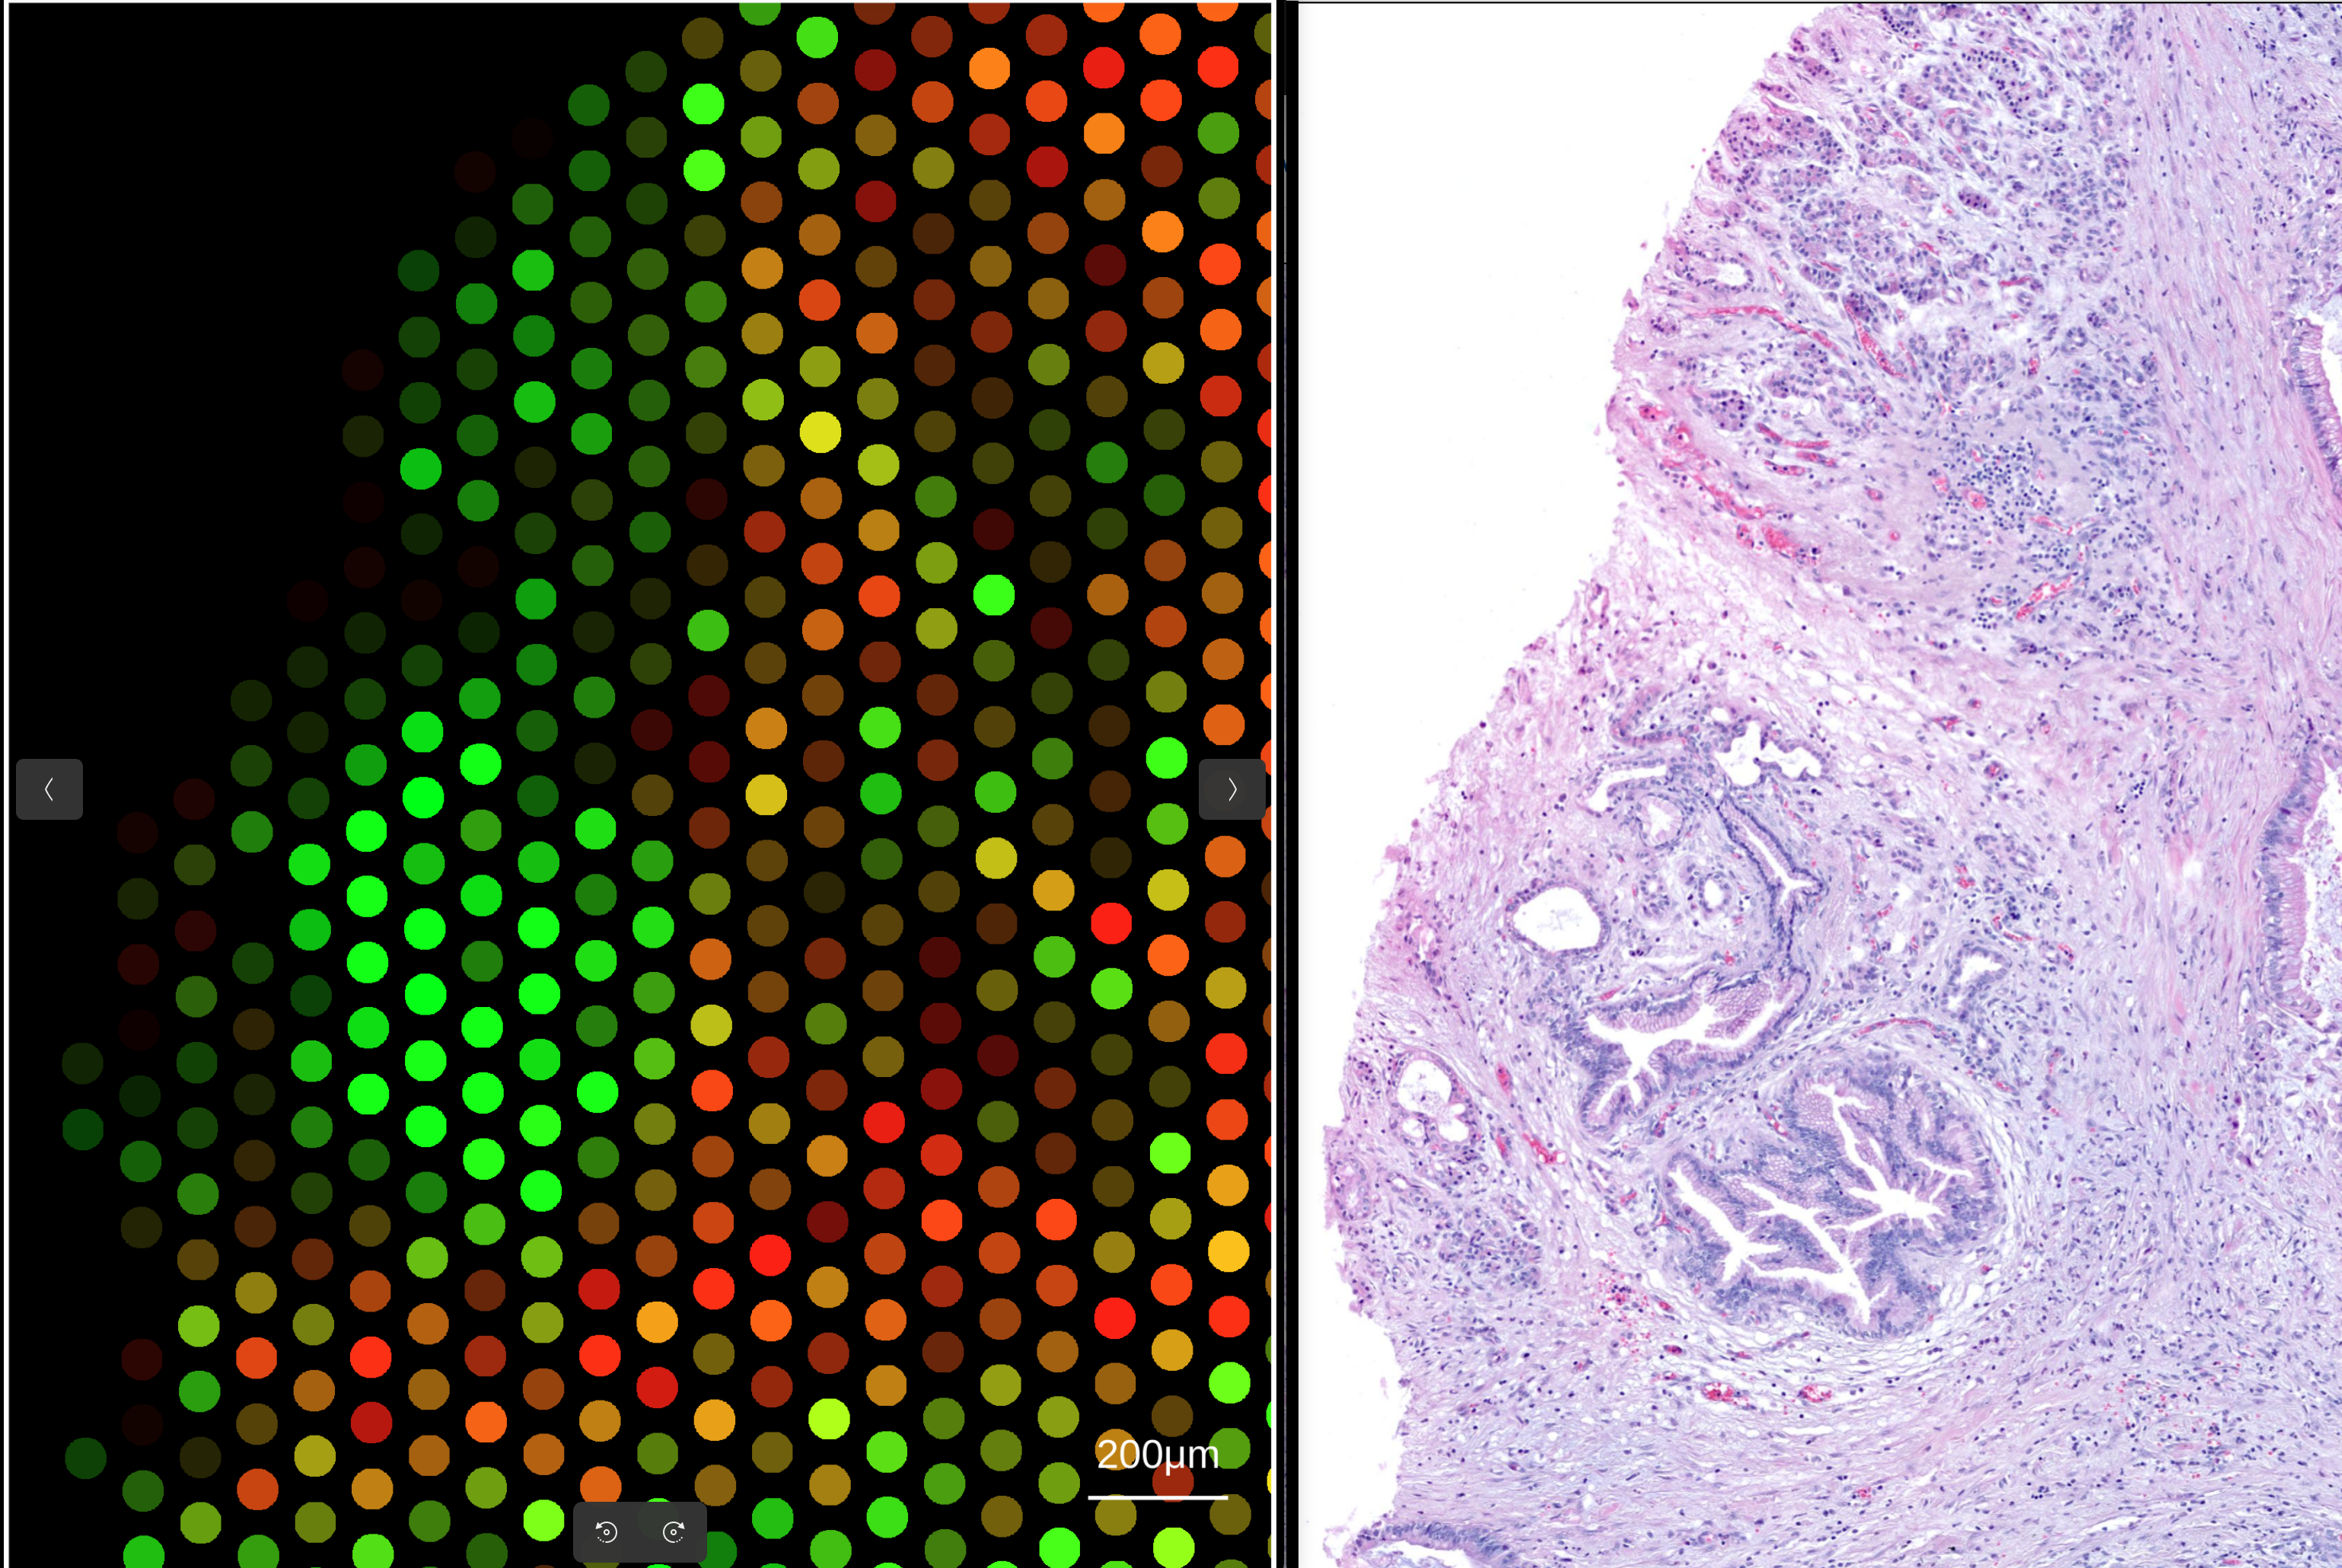
rakaia currently supports WSI aligned views to both 10X Visium and 10X Xenium datasets; additionally, v0.28.0 and later supports this aligned view for other types of assays provided that an affine transformation is loaded. 10X Visium alignment to WSIs is straightforward and requires no additional data processing or file import, as the assay by default retains the global coordinates from the WSI when spots are rendered.
To align the 10X Visium to its matched WSI, simply import a 10X Visium assay into the main canvas tab (see here for importing Visium data) and the corresponding WSI into the osd viewer. Once a Visium blend is made, simply zooming in on a subset of the spots in the main canvas will automatically transfer the coordinate bounds into the WSI view:
Alignments with a transformation matrix e.g. 10x Xenium
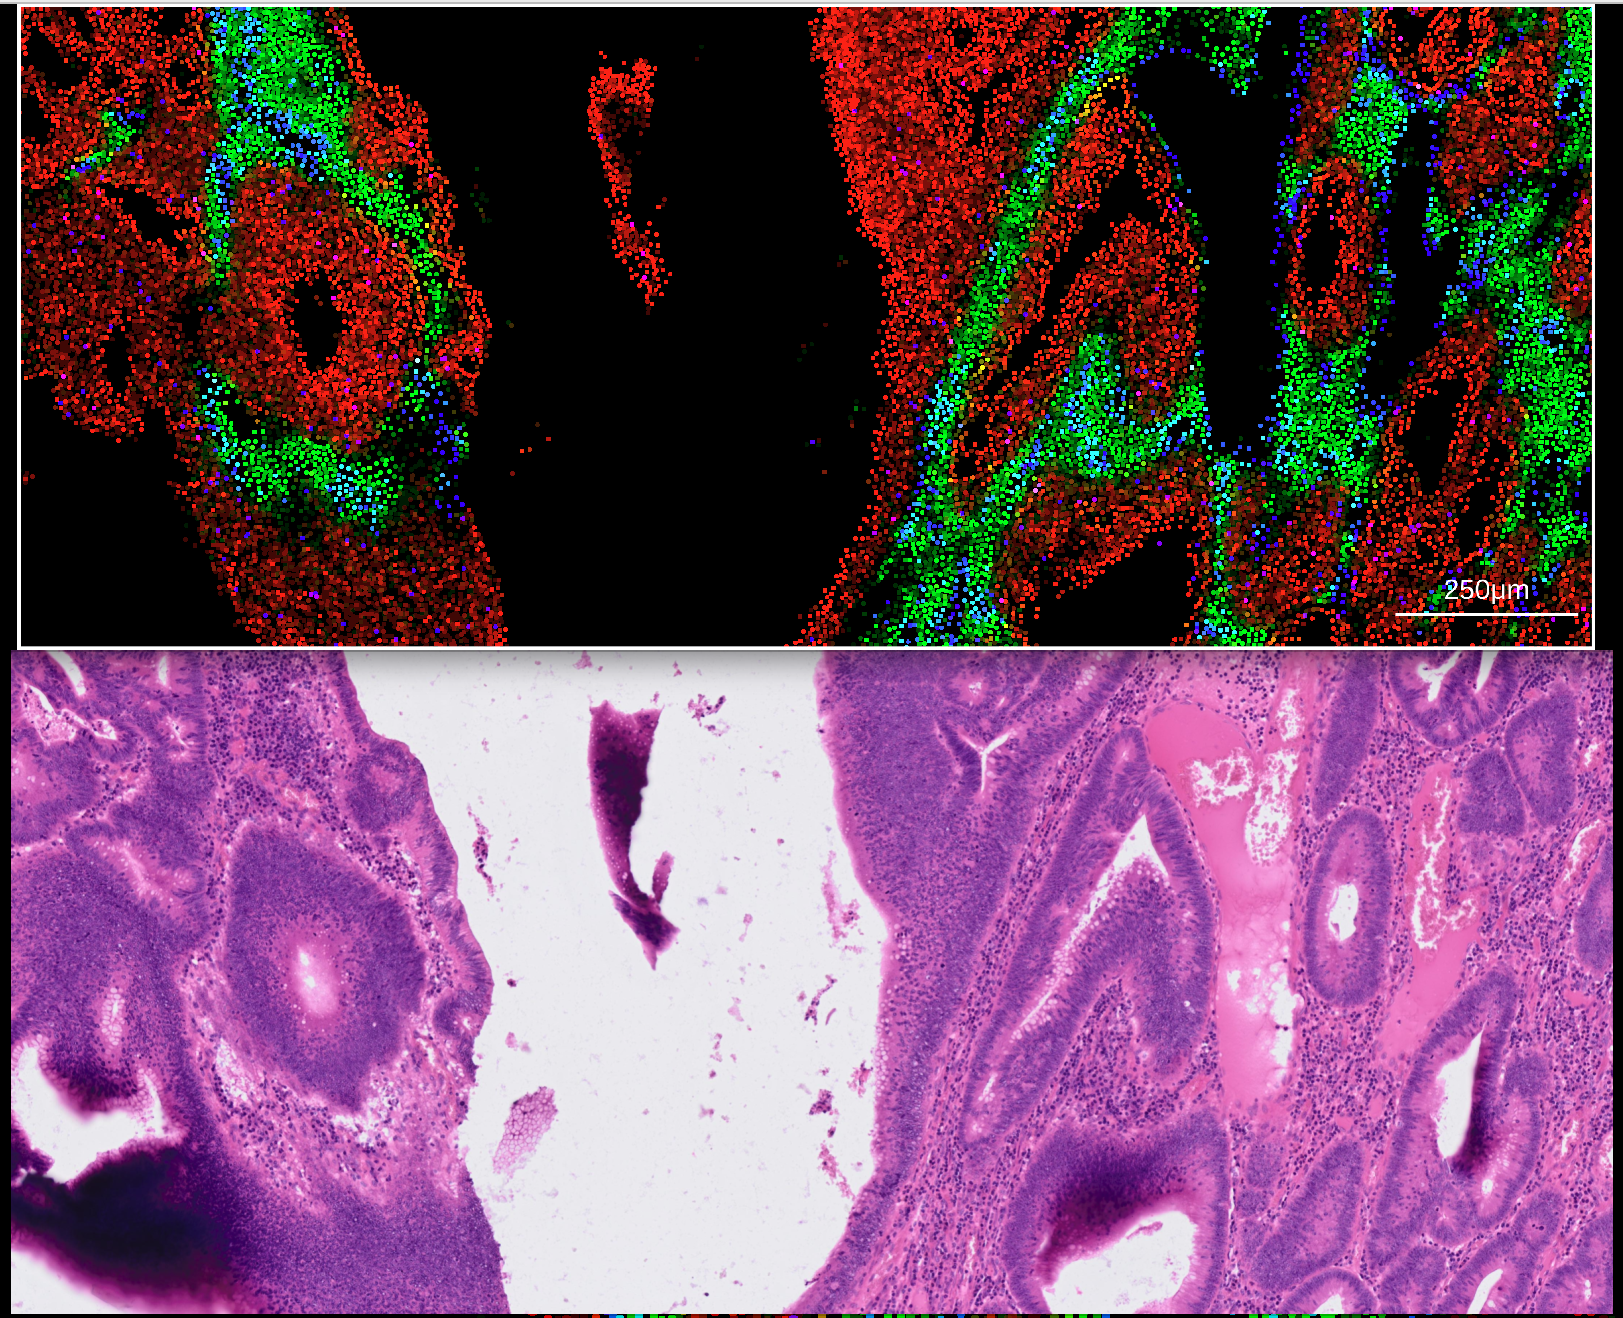
Aligning non-spot-based datasets such as 10x Xenium requires an additional import step of an affine transformation matrix generated from Xenium explorer. Visit this link for 10X vendor information on how to generate a 3x3 affine transformation matrix.
The transformation matrix should be exported in CSV format, and can then be imported into rakaia under File import -> Show/hide additional imports -> Choose or drop affine transformation matrix for WSI. Similar to 10X Visium, both the expression h5ad and WSI for the Xenium assay should be imported into the session. With the addition of the transformation matrix, zooming in on a Xenium canvas blend will trigger an update in the matched WSI:
From rakaia 0.28.0, this matched zoom tracking has been extended to all other supported assay types that can be viewed in the canvas, the only requirement is to have an affine transformation matrix loaded and selected alongside the target WSI.
Starting with v0.26.0, users can import multiple transformation matrices corresponding to multiple different WSIs aligned to multiple regions. For this version and later, users must specify which transformation matrix is to be used for the current WSI with the corresponding dropdown selection:
![]()
Failure to have a transformation matrix selected will result in no matched zooming from the canvas to the WSI view. To assist this selection, rakaia will auto-select the corresponding transformation matrix if the file basename used to import the CSV matches the basename of the WSI import, when the matched WSI is selected from its dropdown.
Xenium image scaling factors
When aligning 10X Xenium WSIs, it is important that the user know which image level/series the WSI is derived from, and set the scaling factor accordingly in the WSI tab. By default, the WSI is assumed to be from the top level (series 0), which has an image factor of 0.2125 (this is the default rakaia value). To change the Xenium scale factor, visit the link below:
Matrix inversion
Starting with rakaia v0.28.0, users will have the option for any imported affine transformation matrix to use the inverted matrix during coordinate transfer.
If the affine transformation matrix maps WSI coordinates into the canvas image coordinate space, users should use the inverted matrix when transferring coordinates. If the opposite applies (the matrix maps canvas coordinates to WSI coordinates), then the user should use the matrix as imported.
Matrix inversion can be set by checking Use matrix inverse under the dropdown for the imported matrices (WSI -> Select/Read WSI)
Setting WSI scale factors for coordinate transfer
As mentioned above, compatible assays such as 10x Visium, or those with a provided affine transformation, can perform matched zooming and tracking between the canvas and osd viewer, where changing the viewport in the canvas will apply zoom in the WSI view to the matched WSI area. To achieve this properly, it is very important to set the correct WSI scaling factor, which is found as an option next to the WSI view.
The broad calculation of the WSI scaling factor is as follows:
wsi scale factor = canvas resolution (µm/pixel) * WSI image resolution (µm/pixel)
For example, when the 10x Xenium assay above, when viewing aggregated cell expression in the canvas at a 1µm resolution with a series 0 magnification on the WSI (0.215µm), setting 0.2125 as the scale factor ensures a proper tracked zoom and pan.
Tips for registering/aligning images
- Alignments should ideally be done on a pixel-to-pixel basis, without factoring in the resolution (µm/pixel) into the transformation matrix. It is recommended to incorporate this conversion directly into rakaia instead with the scale factor as shown above
- Similar to above, if aligning images with landmark coordinate positions in software such as Fiji/QuPath, the scale should be set to
Noneor a resolution of1, to ensure that the coordinates captured are in pixels, not microns