Spatial formats (Anndata, zarr)
Various types of spatially-resolved datasets such as transcriptomics can be visualized and analyzed in rakaia. The preprocessing steps for spatial datasets are slightly different from antibody-based imaging datasets, and will also vary slightly across different technologies.
Required format
Users will likely need to use a spatial analysis library to prepare their data for import, such as spatialdata or scanpy. Import of raw instrument outputs, such as 10x output bundles, are not directly supported.
All spatial datasets that contain marker expression need to be imported into rakaia as one of two formats:
- as a
spatialdatazarrdirectory, created using the appropriate technology-specific reader fromspatialdata. This currently supports 10x Visium, Visium HD, and Xenium. More information onspatialdatafile reading can be found here - as an Anndata object with the file extension
.h5adSpecifically, the Anndata object must have aspatialarray in theobsmslot that contains both the x and y coordinates for each spatial measurement, whether it corresponds to a cell, spot, etc. Libraries such asscanpyandsquidpyare Python libraries that have provide readers for raw spatial data into this format. These libraries will be referenced in the article below.
rakaia currently expects every spatial dataset sample or slide (e.g. Visium slide/Xenium sample run) to be loaded as its own .h5ad file. If users have multiple samples or slides, each with a unique set of spots or in-situ transcripts, the dataset should be divided into multiple Anndata objects and exported as individual files.
rakaia also enables multi-slide datasets with 10x Visium through spatialdata + zarr (more info below).
Importing multiple zarr stores per session
From rakaia 0.26.0 and later, users can import multiple zarr stores into one session provided that the biomarker panel is the same across all samples. For example, with the following data directory structure:
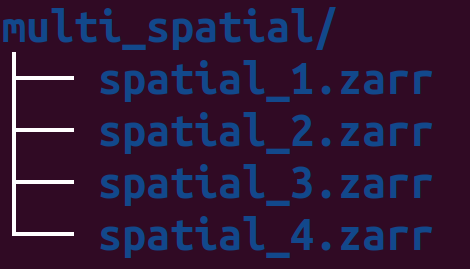
The user can import all 4 spatial ROIs into the session by simply importing from the parent filepath:
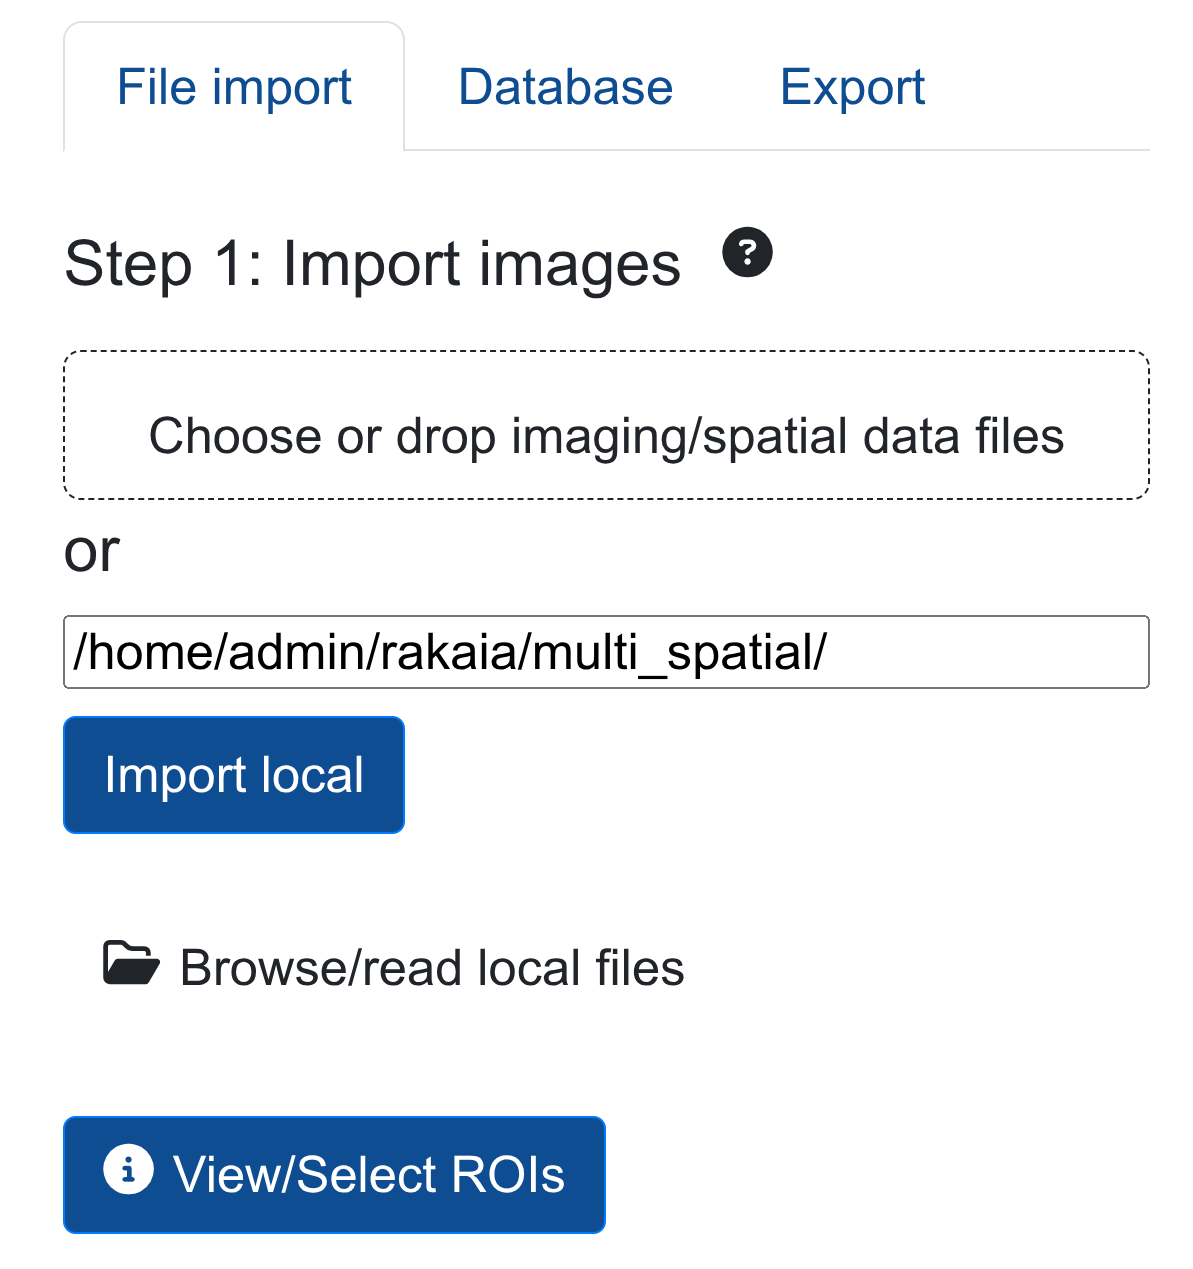
This will parse all 4 zarr directories into the session, allowing for efficient multi-sample or multi-slide spatial analysis.
Spot-based assays: 10X Visium V1, V2
Spot-based spatial technologies such as the 10X Visium Spatial Gene Expression profile transcript counts summarized at the spot level. The Visium technology is capable of profiling tens of thousands of markers per spot, providing comprehensive spatial context of the transcriptome.
Raw Visium data (from the space ranger standard directory output as described here) should be read using either read_visium function from either scanpy or squidpy. Below is a minimal example showing how the data can be preprocessed and exported into a compatible file format:
import squidpy as sq
import os

# specify the input directory with the outs subdir
input_dir = "/path_to_visium_raw/outs/"

adata = sq.read_visium(input_dir)
adata.var_names_make_unique()

# specify the output file as an anndata object
out_anndata = "/output_dir/visium.h5ad"
adata.write_h5ad(out_anndata)
The output h5ad Visium file should typically not be larger than 200-300mb. If the size significantly exceeds this range (1-2 GB or larger), then it is likely that the user has cached a full-sized WSI (i.e. H & E) in the file. Caching these large images will result in significant performance slowdowns in rakaia. To avoid this, users should ensure that the uns slot in the object is cleared of any fields except the required scalefactors slot:
adata.uns = {'spatial': {str(list(adata.uns['spatial'].keys())[0]): {
           'scalefactors': adata.uns[
               'spatial'][list(adata.uns['spatial'].keys())[0]]['scalefactors']}}}
This retains the scale factors required for Visium to render in rakaia, while removing any additional slot caches that rakaia does not use.
When the Anndata object is read into rakaia, the spot size and region dimension will automatically be computed from the spatial coordinates and scale factors:
10x Visium with spatialdata + zarr
Visium assays read through a spatialdata zarr directory can have multiple samples/slides. Every unique sample or slide should have its own shape frame in the shapes slot. The spatialdata_io.visium reader should be used to generate the zarr store (More information can be found here)
Non-spot based assays
Non spot-based assays behave differently in rakaia as the user has more flexibility over the visualization parameters. Specifically, this means that the user may specify a unique visualization size for the data in the image, which isn't supported with spot-based assays because the spot scaling factors are computed automatically from the input data.
Binned expression assays: 10x Visium HD
The HD version of 10X Visium differs slightly from the spot-based technology used in either V1 or V2. Instead of using circular spots that have gaps among them, HD offers tiled, barcoded squares without gaps, as described here. This results in data that can be binned at summarized at three different micron resolutions: 2, 8, and 16.
Currently, the only supported reader in Python for HD datasets is the spatialdata HD reader. The reader generates aggregate expression profiles for each micron resolution, and each of these profiles can be exported as an Anndata file for visualization in rakaia. This example notebook here shows an example of how to export these binned profiles. each bin can then be imported into rakaia as a separate ROI with the same set of marker genes, but with different dimensions and resolution.
Visium HD with spatialdata + zarr
Visium HD assays read through spatialdata + zarr will be split into multiple ROIs based on the bin size. The zarr store should have a matched shape + table slot for every bin size with the following table keys: 'square_002um', 'square_008um', 'square_016um'.The spatialdata_io.visium_hd reader should be used to generate the zarr store (More information can be found here)
rakaia will output only the bins for 8 and 16um, as the 2um bin size is both too sparse and large to effectively render.
From rakaia v0.25.0, the segmentation masks for Visium HD will be available for the bin sizes above. However, due to the binning resolution, the masks will not retain the same shape and resolution as they would appear in the Visium HD cell segmentation summary, so they should be used more for positional inference or object ID annotation rather than accurate spatial projection.
10X Xenium In-situ Expression
The 10X Xenium platform differs slightly from the assays above as it profiles in-situ transcript counts, and also supports segmentation and the overlay of object masks. The notebook example here provides a complete example of reading the data into a spatialdata object and exporting both the expression Anndata object as well as the separate cell segmentation mask as a tiff.
Xenium with spatialdata + zarr
Xenium read through spatialdata + zarr should be a single slide/ROI per zarr directory. The zarr store will parse for cell or nucleus segmentation objects in the following shapes slot keys: 'cell_boundaries', 'cell_circles', 'nucleus_boundaries', and will import the cell boundary mask. These slots are strictly optional; if no segmentation results are found, then rakaia will parse the spatialdata store as a default expression Anndata (see below)
Users are encouraged to create a "lean" spatialdata object store with the code template below, where large-memory data structures that rakaia currently does not import are ignored; this will benefit the user by minimizing memory usage when creating spatialdata stores, and make them faster to read in rakaia sessions:
sdata = xenium(xenium_raw_output_dir, morphology_focus=False, cells_boundaries=True,
                   morphology_mip=False, aligned_images=False, transcripts=False,
                   nucleus_boundaries=False, nucleus_labels=False,
                   cells_table=False, cells_labels=False, transcripts=False,
                   n_jobs=8)
In the template above, the resulting sdata object will contain only the cell aggregated probe/transcript counts as well as the cell boundary mask, which are both rendered by rakaia. Other large data stores such as high-res morphology images, nuclei-related outputs, and individual transcript counts are currently not used by rakaia, so withholding them from the spatialdata object will make reading large Xenium samples much more memory-friendly and faster.
Rakaia supports both the spatialdata_io.xenium and sopa.io.xenium API for spatialdata zarr stores.
Rakaia currently does not import or render the morphology_focus images in the Xenium outputs, only the cell-level trabnscripts and segmentation masks. This feature may be added in future versions.
CosMX
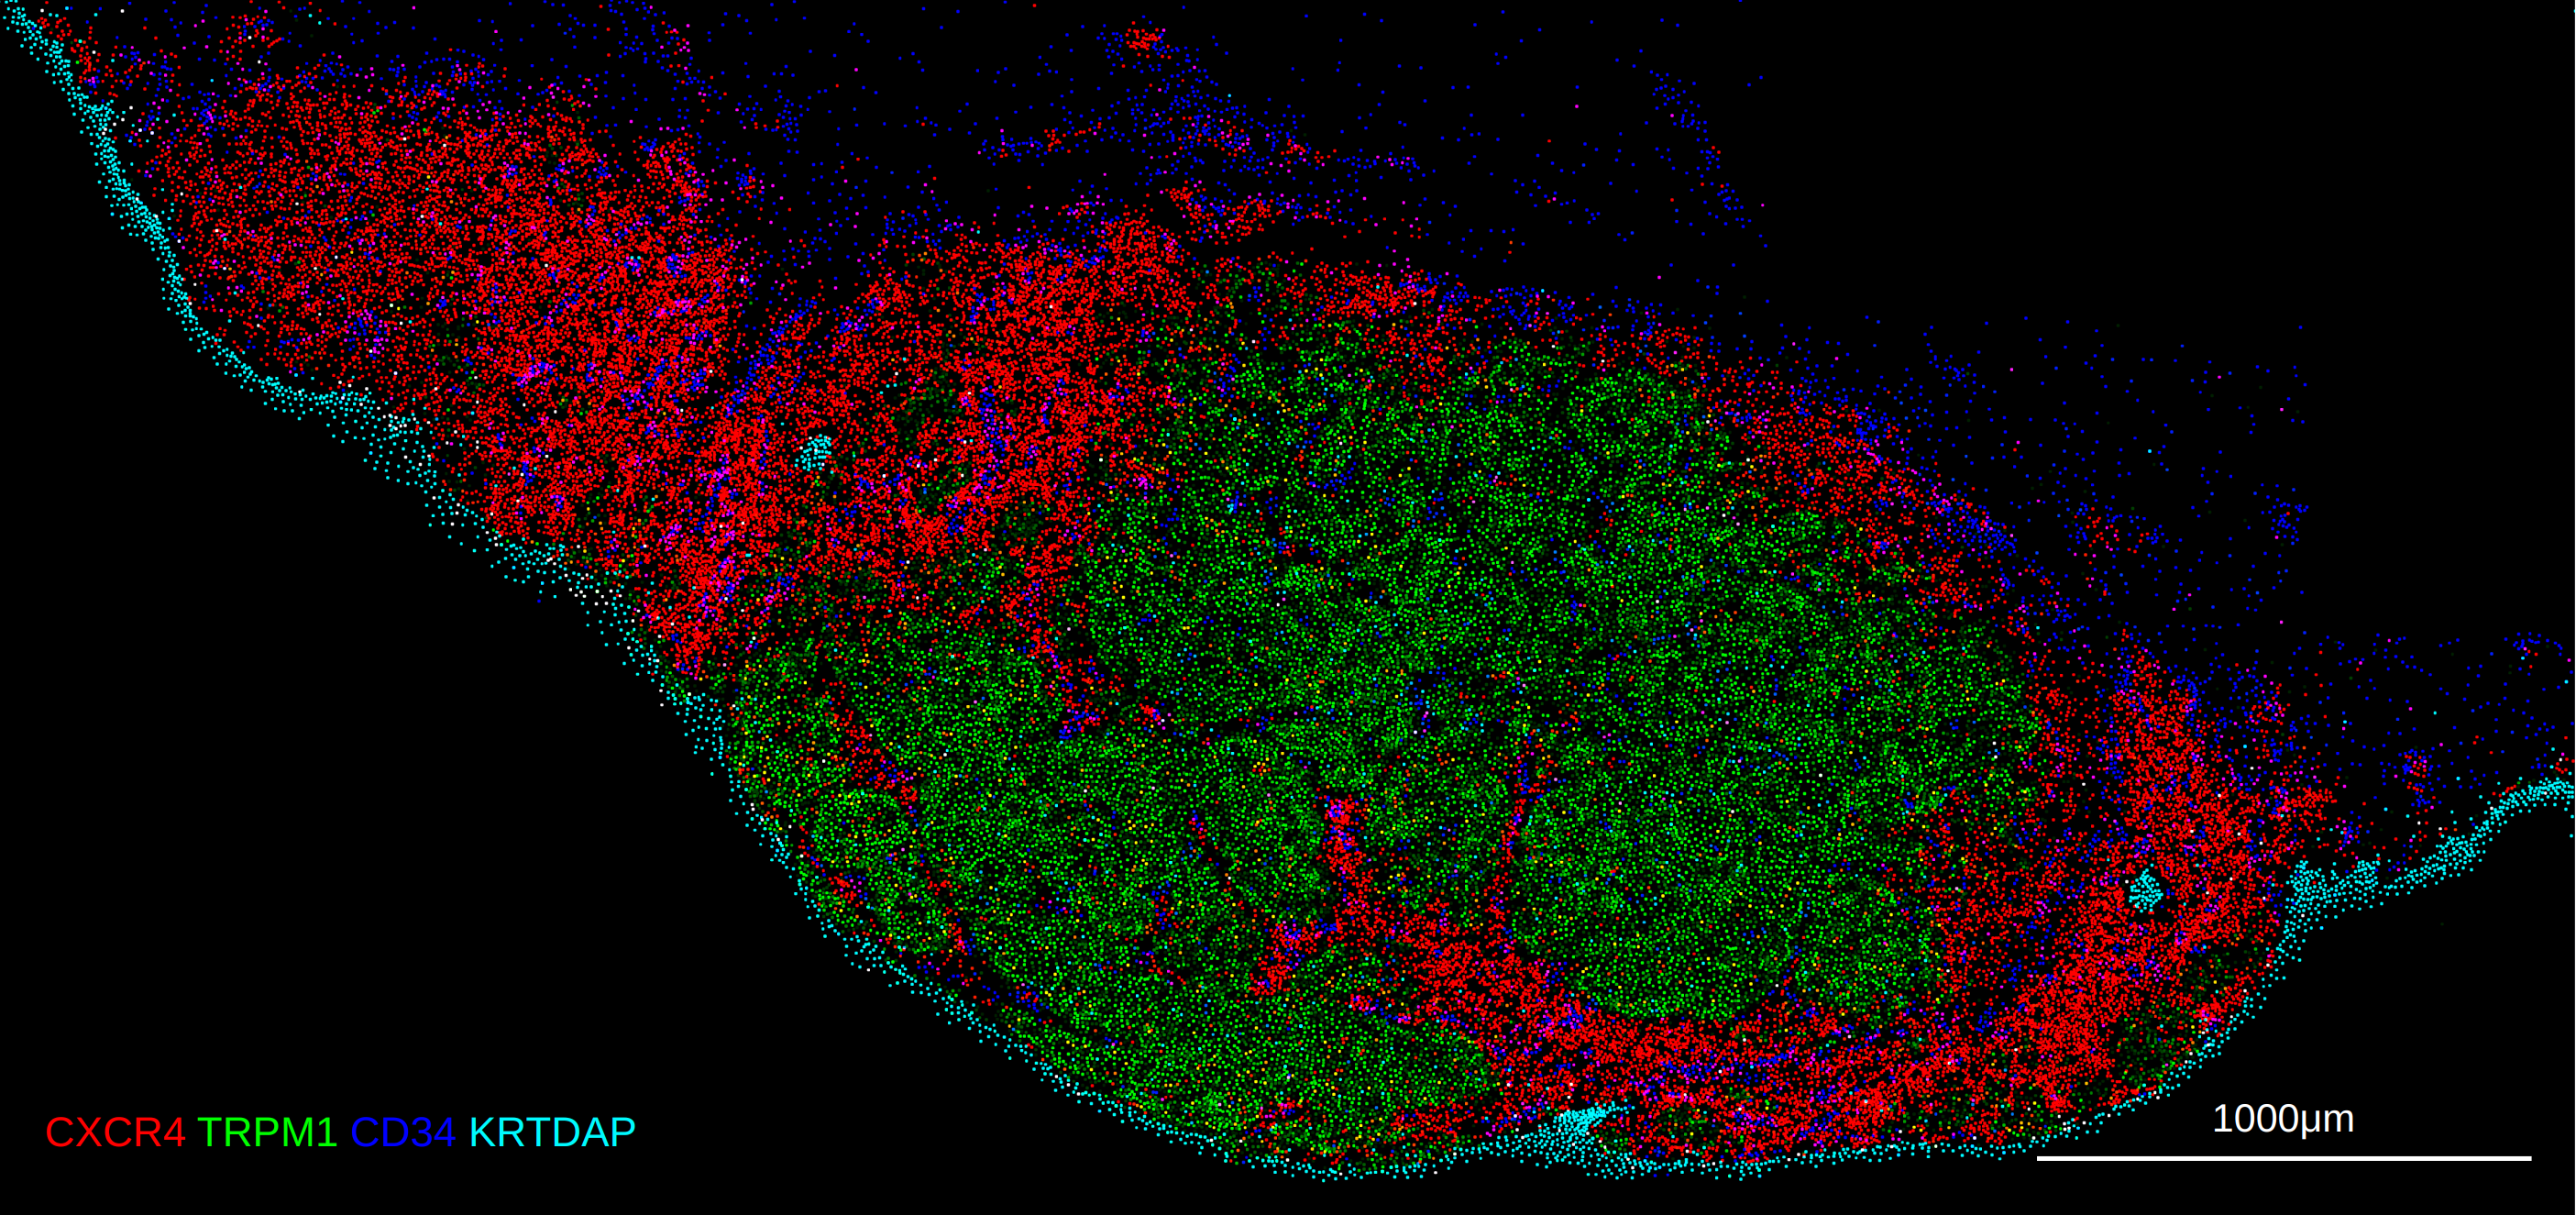
Rakaia can support preprocessed CosMX assays. The recommended approach is to read the entire raw directory putputs with a processing library such as Voyager or Seurat in R and then split the data into the FOVs to make visualization more performant and manageable. Below is an example of processing the data using Voyager and SpatialFeatureExperiment using the publicly available non-small cell lung cancer dataset found here: https://pachterlab.github.io/voyager/articles/vig4_cosmx.html, which is the same as: https://brukerspatialbiology.com/products/cosmx-spatial-molecular-imager/ffpe-dataset/nsclc-ffpe-dataset/. In the example below, the entire dataset is read into a SpatialFeatureExperiment, and each FOV is written to a separate file (one .h5ad for cell expression, and a tiff for the cell segmentation) in the same directory as the script.
The example below showcases how to prepare CosMX data from a SpatialFeatureExperiment class in R. For an example of preparing the data from a Seurat object, see the example R markdown here.
library(Voyager)
library(SFEData)
library(Seurat)
library(SingleCellExperiment)
library(zellkonverter)
library(anndata)
library(SpatialFeatureExperiment)
library(reticulate)
library(sf)
library(terra)
library(stringr)

ad <- import("anndata")
sp <- import("scipy.sparse")
np <- import("numpy")

# set the output directory to the same place as this file: user can change
setwd(dirname(rstudioapi::getSourceEditorContext()$path))

sfe <- HeNSCLCData()

# set the micron resolution in the output image (1 matches the cell expression)
res <- 1

coords <- spatialCoords(sfe)

#IMP: get the offset before the shift to apply to the cell polygons
shift <- c(min(coords[,1]), min(coords[,2]))

# shift so min = 0
coords[,1] <- coords[,1] - min(coords[,1])
coords[,2] <- coords[,2] - min(coords[,2])

spatialCoords(sfe) <- coords

# shift the cell segmentation polygons to match the expression

polygons <- colGeometry(sfe, type = "cellSeg")
geom_shifted <- st_geometry(polygons) - shift
seg_sf <- sf::st_as_sf(geom_shifted)
rownames(seg_sf) <- colnames(sfe)
colGeometry(sfe, type = "cellSeg") <- seg_sf

# get the FOVs
sfe$fov <- str_split_fixed(rownames(spatialCoords(sfe)), "_", 2)[,1]

for (fov in unique(sfe$fov)) {

  fov_identifier <- ifelse(nchar(as.character(fov)) == 1, paste("0", fov, sep=""), fov)

  subset <- sfe[,sfe$fov == fov]
  coords_mat <- as.matrix(spatialCoords(subset))

  # IMP: flip the y coordinates to match the mask and rakaia origin (top left is (0,0))
  coords_flipped <- coords_mat
  coords_flipped[,2] <- max(coords_mat[,2]) - (coords_mat[,2] - min(coords_mat[,2]))

  storage.mode(coords_flipped) <- "integer"

  stopifnot(all(rownames(coords_flipped) == colnames(subset)))

  counts <- t(assay(subset, "counts"))
  X <- r_to_py(counts)
  X <- X$tocsr()

  adata <- ad$AnnData(X = X)

  adata$obs_names <- rownames(counts)
  adata$var_names <- colnames(counts)

  # These uns variables can be used for stitching
  adata$uns$cosmx_global_max <- list(
    x = as.numeric(max(coords[,1])),
    y = as.numeric(max(coords[,2])))

  # set the flipped spatial coordinates
  adata$obsm[["spatial"]] <- r_to_py(coords_flipped)

  write_h5ad(adata, paste("HeNSCLC_fov_", fov_identifier, ".h5ad", sep=""))

  sf_polys <- st_as_sf(colGeometries(subset)$cellSeg)

  r <- rast(
    xmin = as.integer(min(coords_flipped[,1])),
    xmax = as.integer(max(coords_flipped[,1])),
    ymin = as.integer(min(coords_flipped[,2])),
    ymax = as.integer(max(coords_flipped[,2])),
    resolution = res)

  # give each mask fill a unique ID
  sf_polys$value <- seq_len(nrow(sf_polys))

  rasterized <- rasterize(
         vect(sf_polys),
         r,
         field = "value",
         background = 0)

  writeRaster(rasterized, paste("HeNSCLC_fov_", fov_identifier, "_mask.tiff", sep=""), overwrite=TRUE)

}
The example above features a dataset where all of the spatial coordinates are above 0, however, some CosMX datasets will have coordinates centered on a different origin, and can therefore have negative spatial coordinates, which may be incompatible with certain visualization software. The example above includes the code required to shift both the spatial coordinates and cell polygons to above 0 for compatibility in Rakaia.
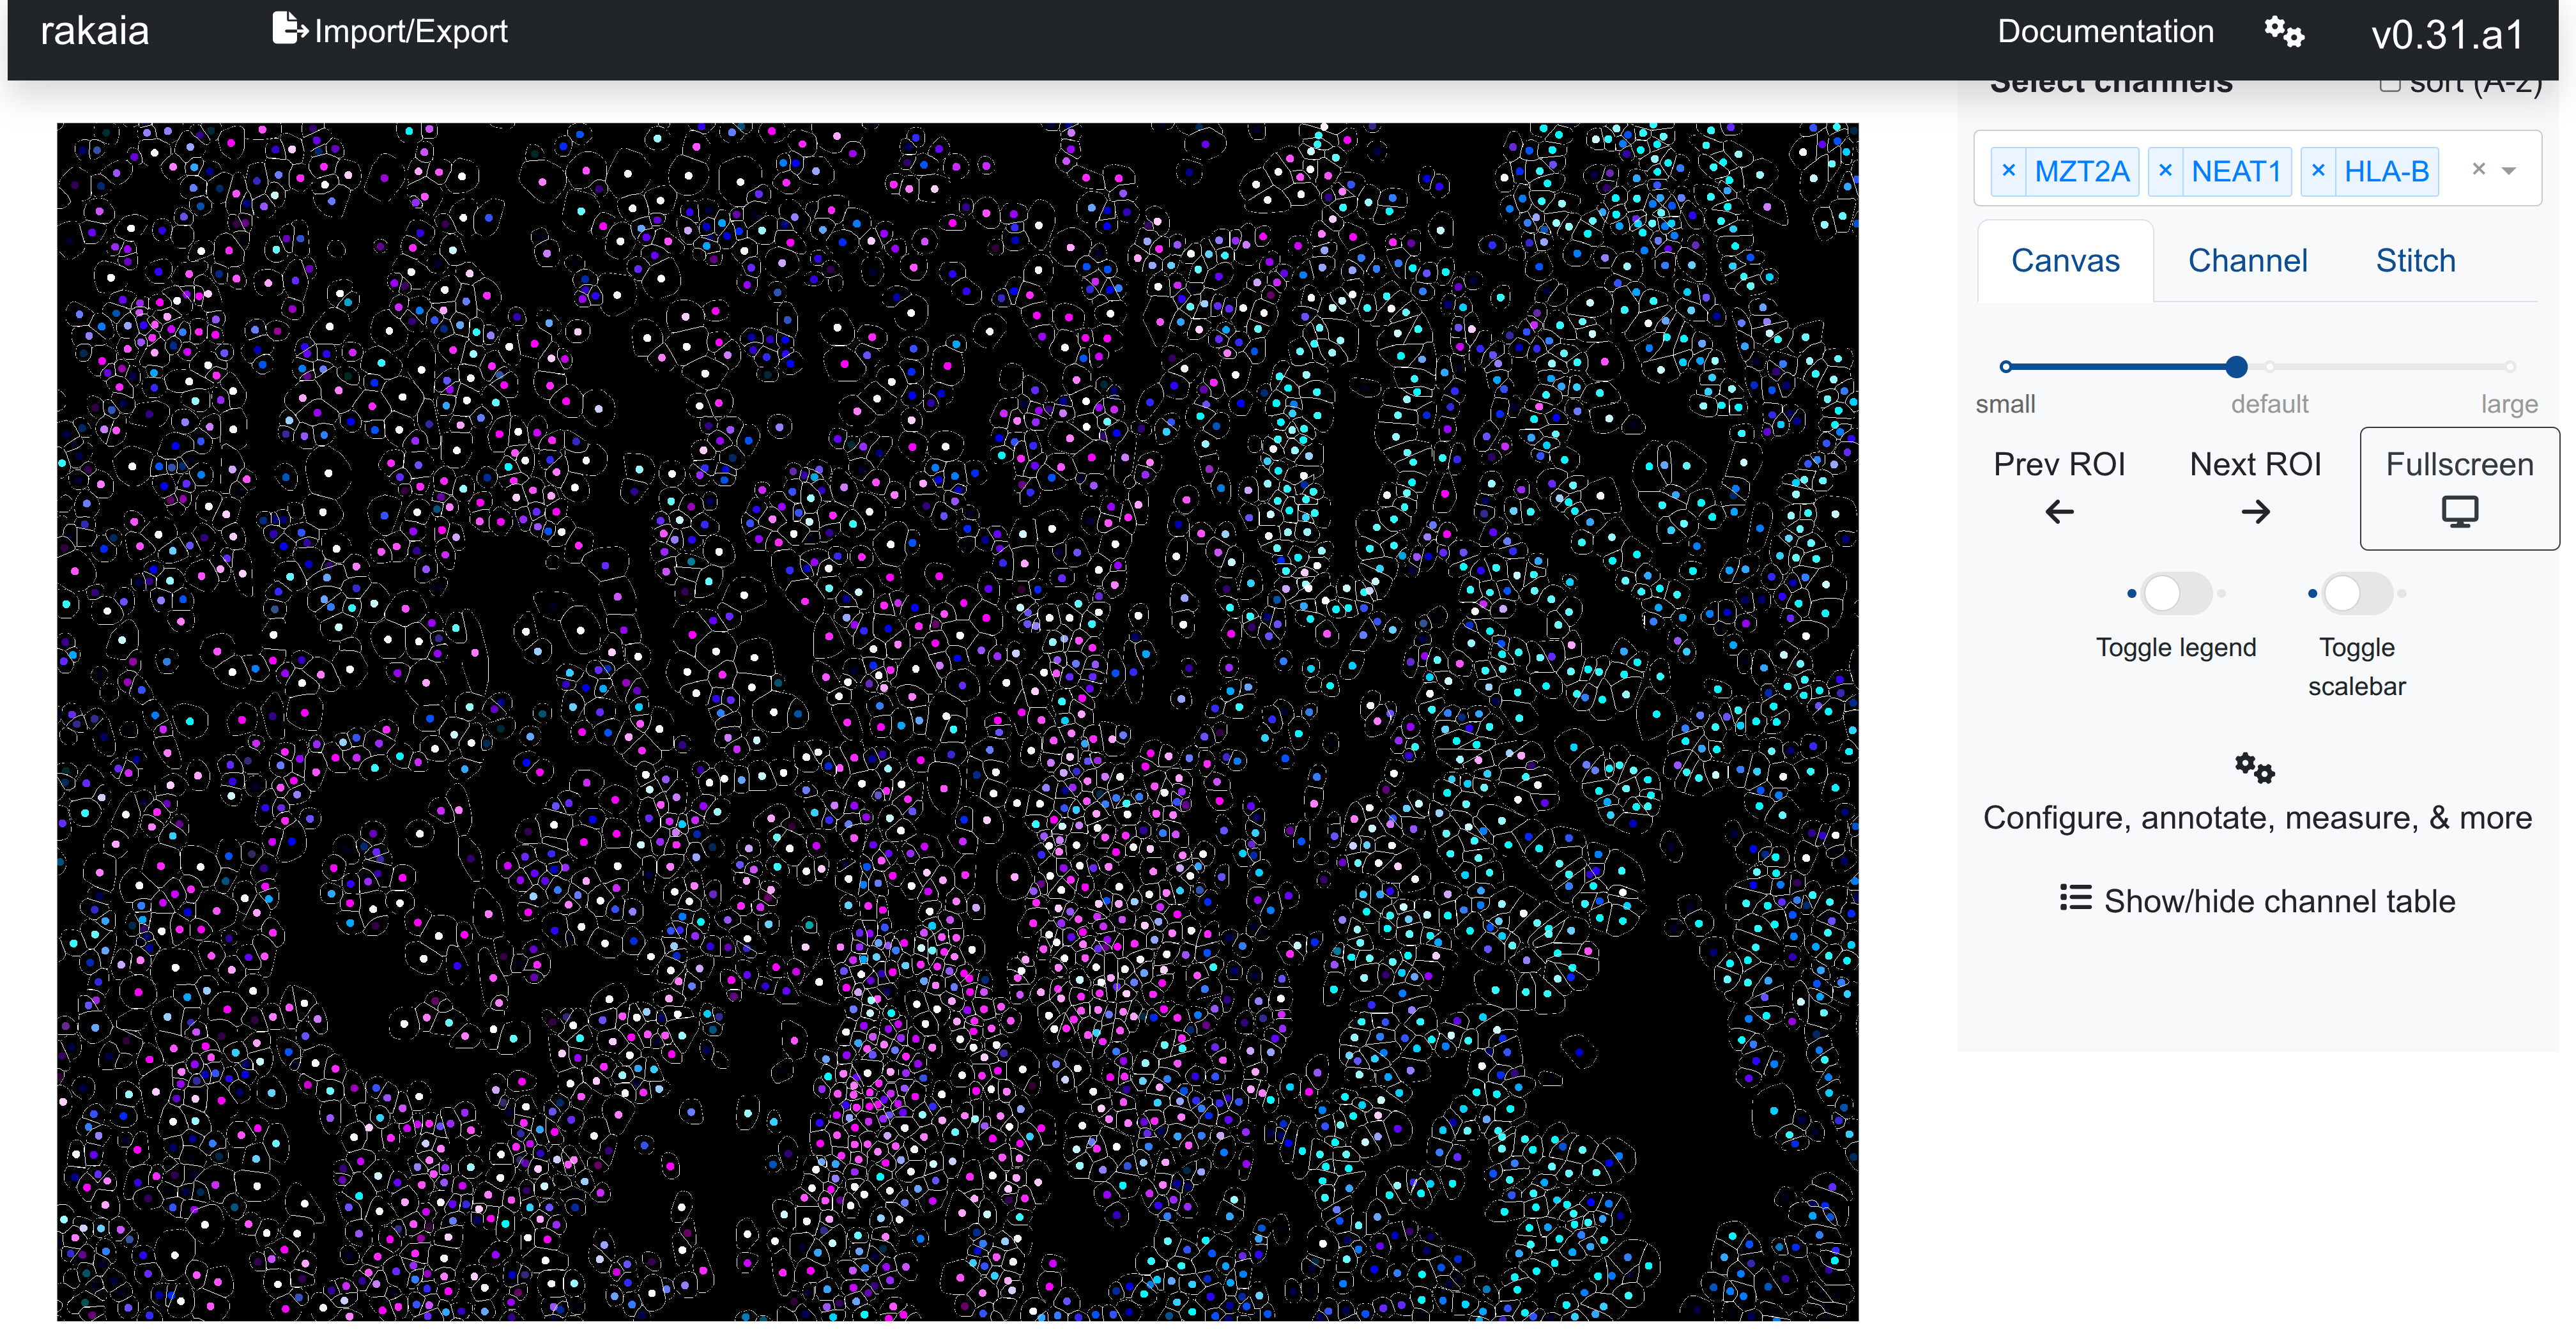
These files can then all be imported into a single rakaia session, with name matching for the h5ad files to the mask tiffs. The channel canvas blend will show markers blended at the cell centroids, similar to Xenium:
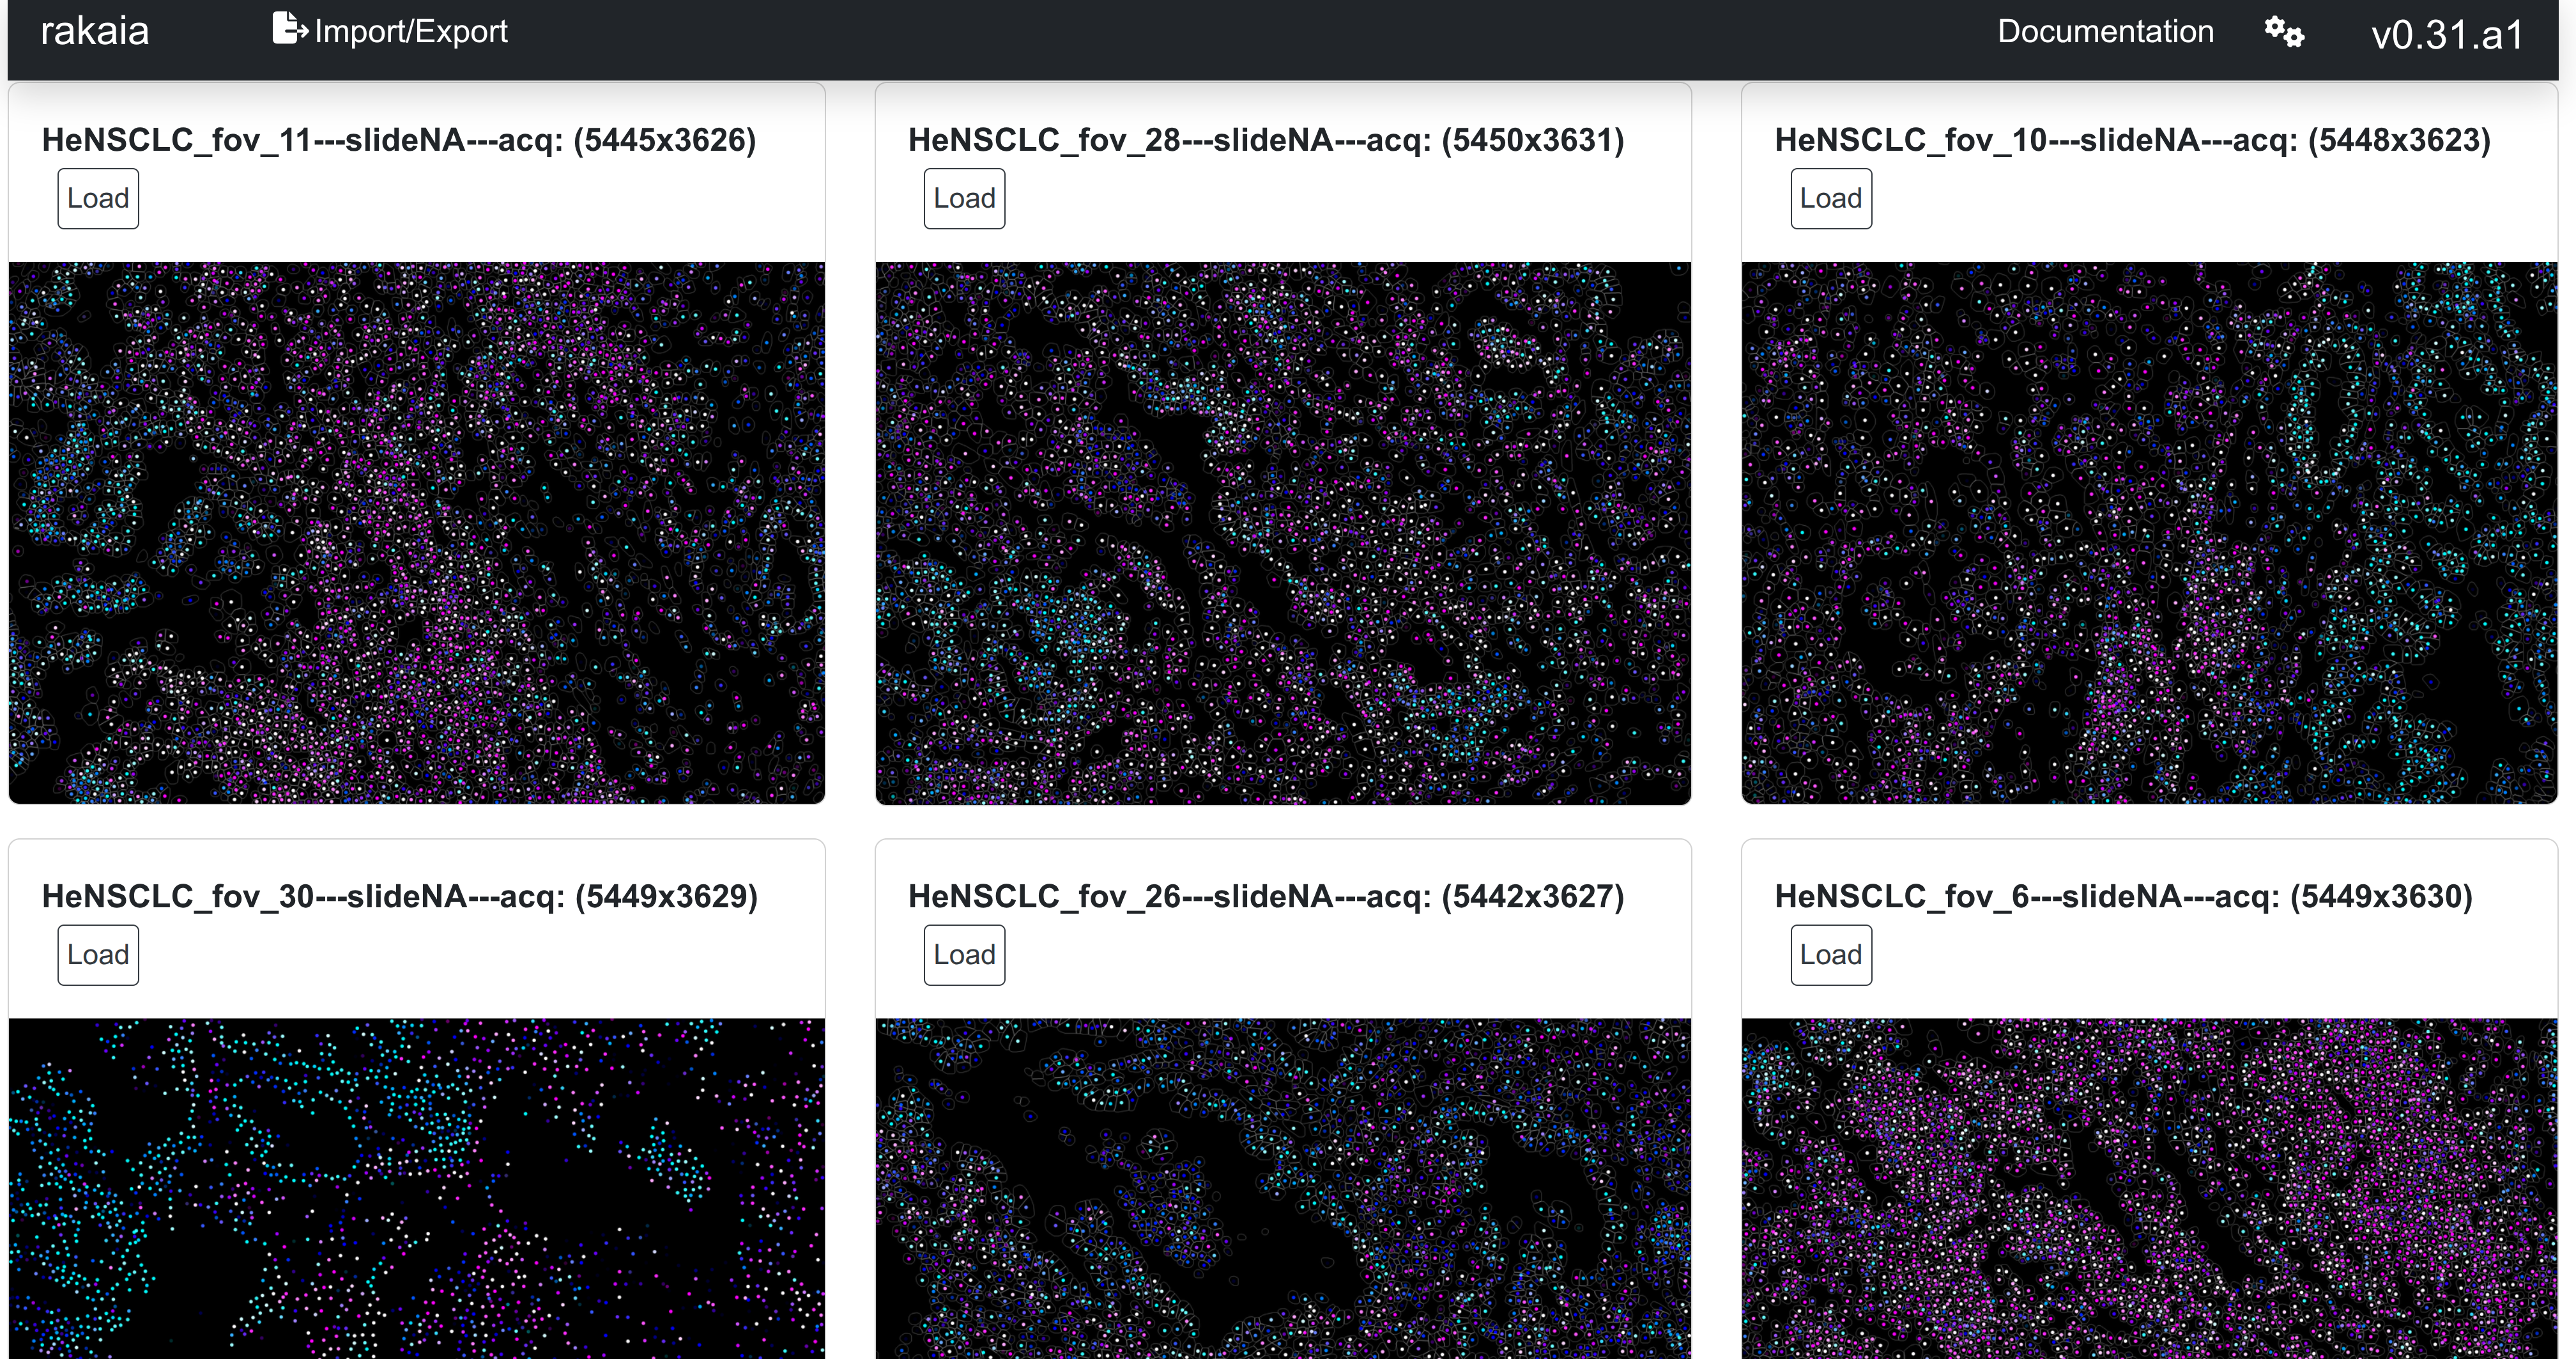
And can also be browsed using the dataset gallery
Rakaia v0.32.0 and later supports stitching of the CosMX FOVs into a single large RGB mosaic. Visit the article on stitching for more information.
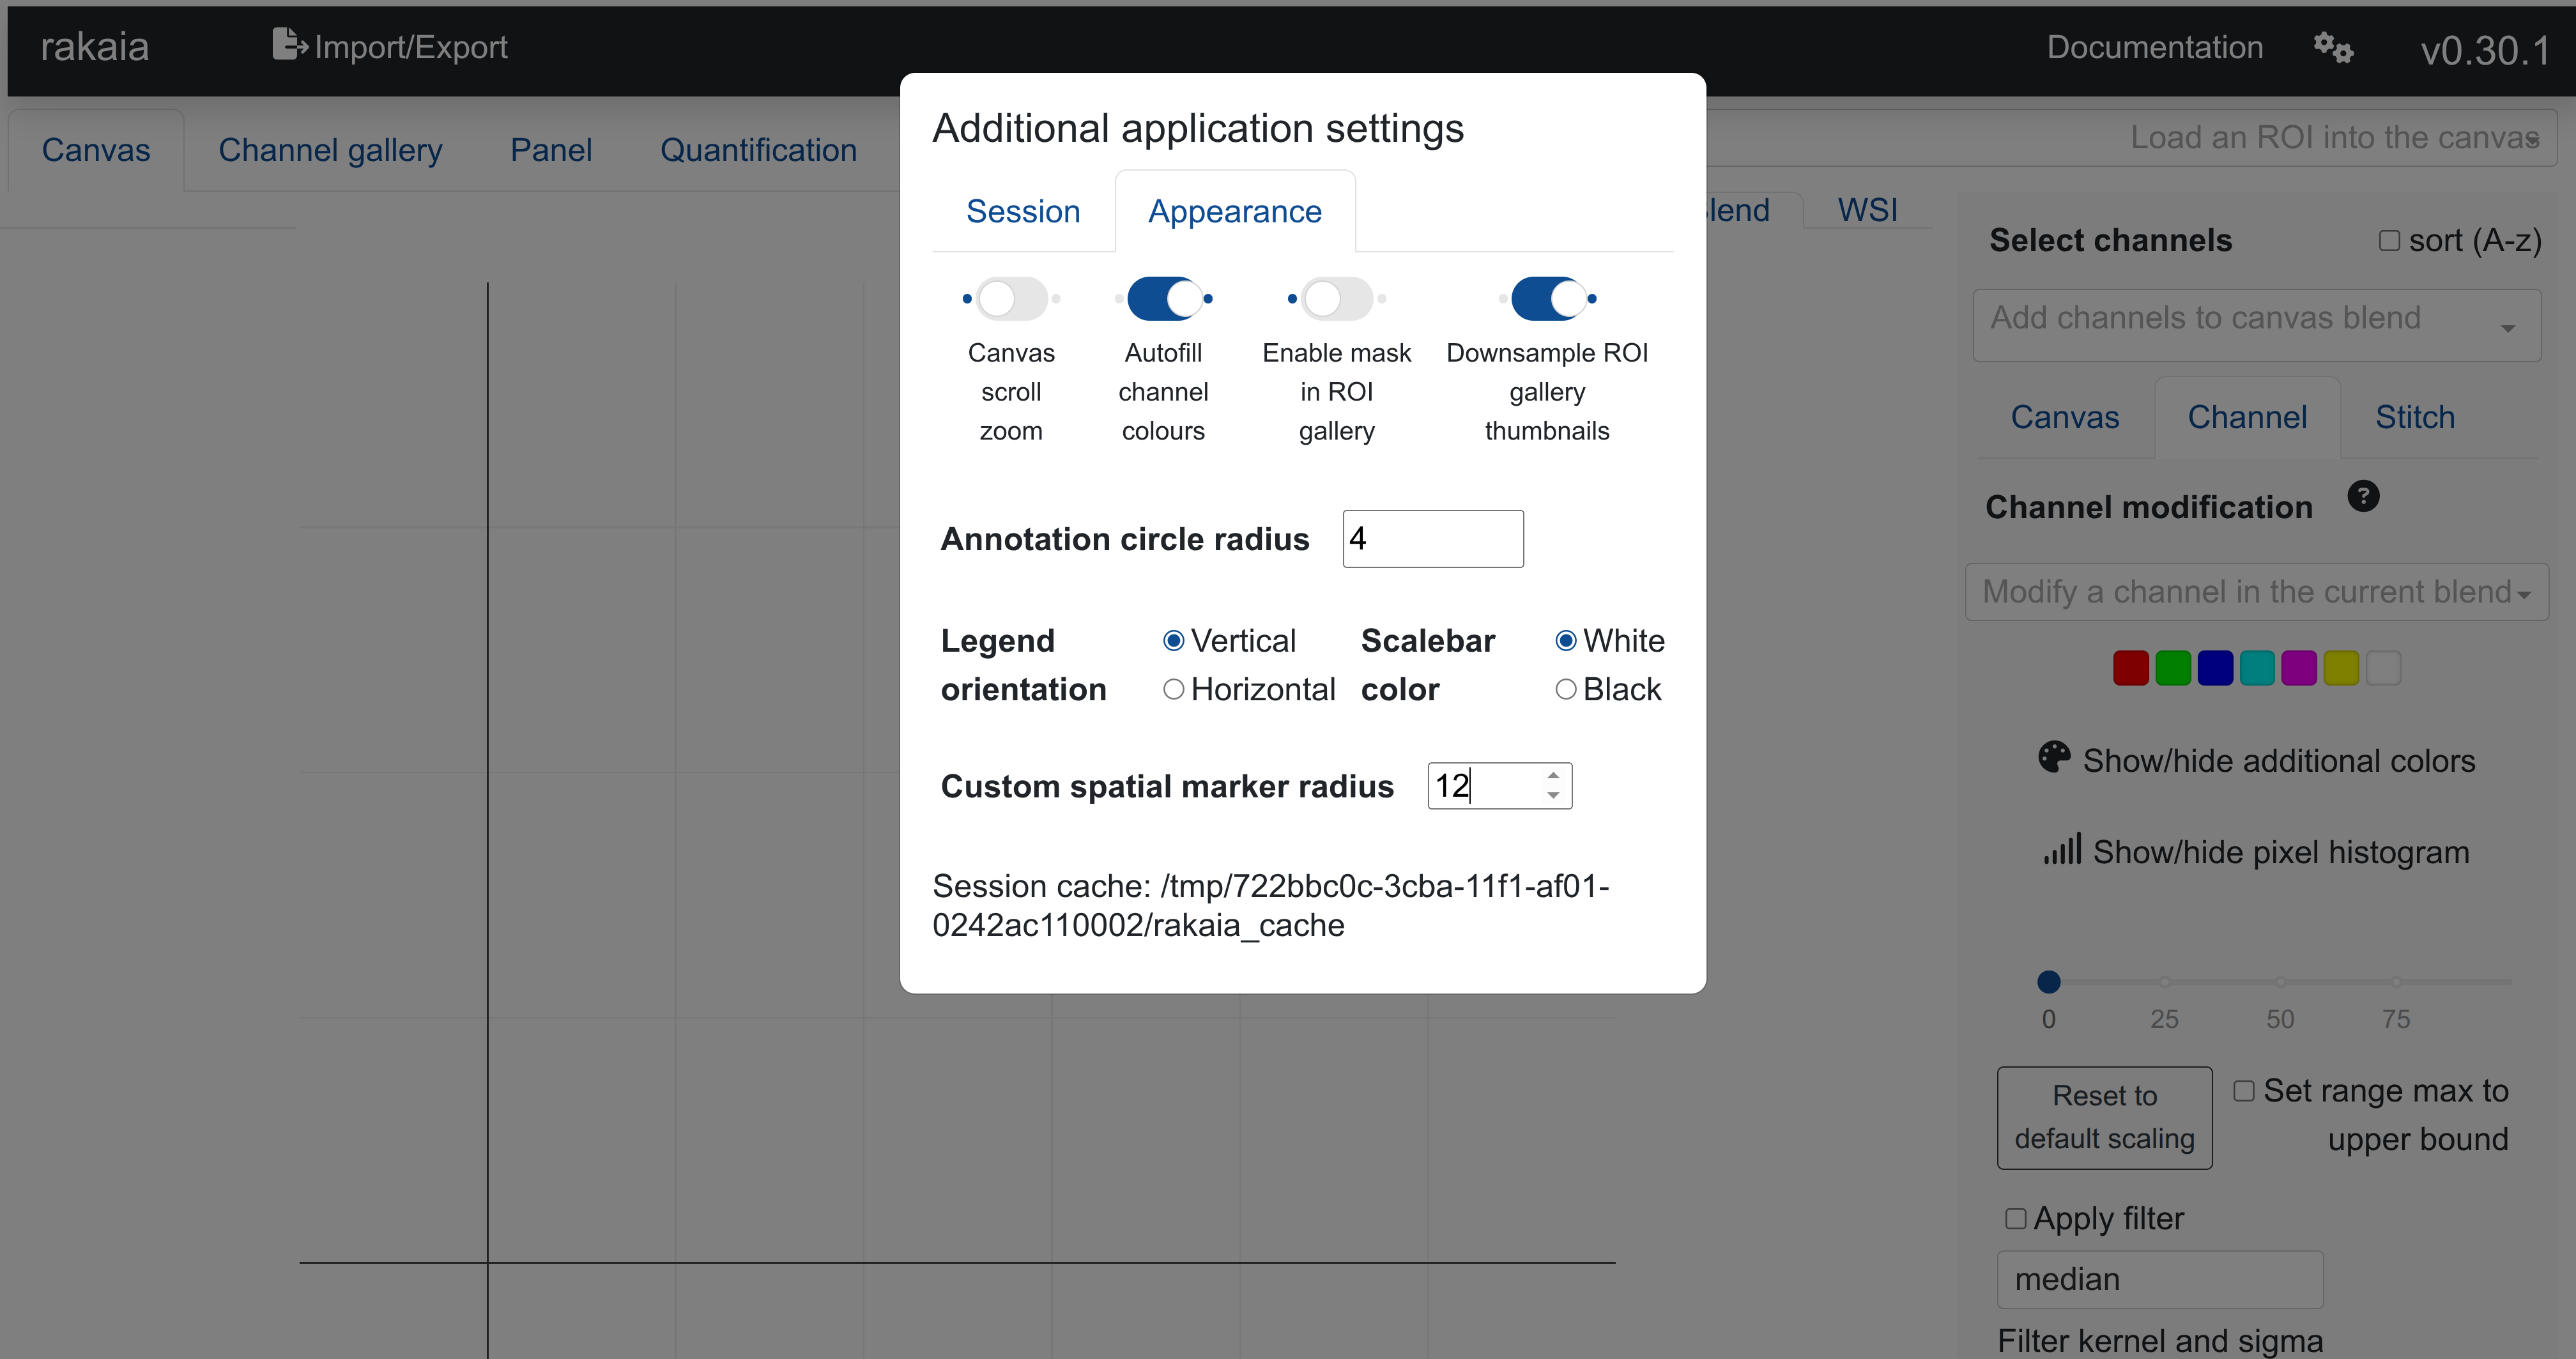
Users may want to set a larger marker size radius for CosMX (10-12). This can be achieved under Additional application settings -> Appearance, which is accessed from the gear icon in the top right corner:
Setting marker sizes for visualization (non spot-based)
The non spot-based technologies above support custom user marker sizes in rakaia. This means that the marker can be visually enlarged or minimized down to a minimum size of 1 pixel in the viewer. This allows the expression to appear more granular/minimal or more extensive/uniform throughout the ROI as the user desires.
Below are some recommended marker sizes for the different technologies listed above. The marker size can be changed under Additional application settings -> Appearance -> Custom spatial marker radius.
-
10X Visium HD: 3-4. A marker size of 2 will generally reveal pixel gaps between areas of expression, with 3 removing those gaps and providing a more uniform, albeit maybe slightly blurred, expression visualization. Generally, marker sizes of 4 of greater will cause expression to overlap erroneously.
-
10X Xenium: 4-6. The marker size should be set based on the presence of an overlaid segmentation mask. Without using a segmentation mask, larger marker sizes up to 4 will make the expression more visually appealing at a global resolution, but could result in markers that "spill" out of the segmentation mask. When using a mask, values of 2-3 allow the marker to appear in the centroid of the cell mask while also allowing the expression to appear at the global resolution.
-
CosMX: 10-12. Due to the resolution and the rasterization of the cell segmentation masks, users may prefer a high marker size. This can however be dependent on the size of the dataset and each FOV.
it is recommended to change the marker spatial size with at least one channel present in the canvas. Changing the marker size on a blank canvas will result in channels previously selected, but not currently included in the blend, to be not updated with the latest marker size.
Setting a larger marker size increases the possibility of seeing overlapping or fragmented expression points in 10X Xenium assays. This is particularly noticeable in dense tissue where cells may be close together, or areas where it is difficult to clearly segment cell boundaries. Additionally, filtering transcripts using a lower bound may cause visual fragmentation of points, as a portion of the overlapping expression point may be filtered out. In these instances, users may want to reduce the marker size incrementally until the markers no longer touch/overlap.
The default marker size for spatial assays is set at 4 (increased to 6 in Rakaia v0.32.0 and later).
Differential gene expression (DGE) for Anndata or zarr datasets
Starting in Rakaia v0.30.0, users who have applied a categorical overlay inside the segmentation mask of an Anndata or zarr-derived ROI can compute a differential gene expression table to get the top associated markers for each category in the overlay.
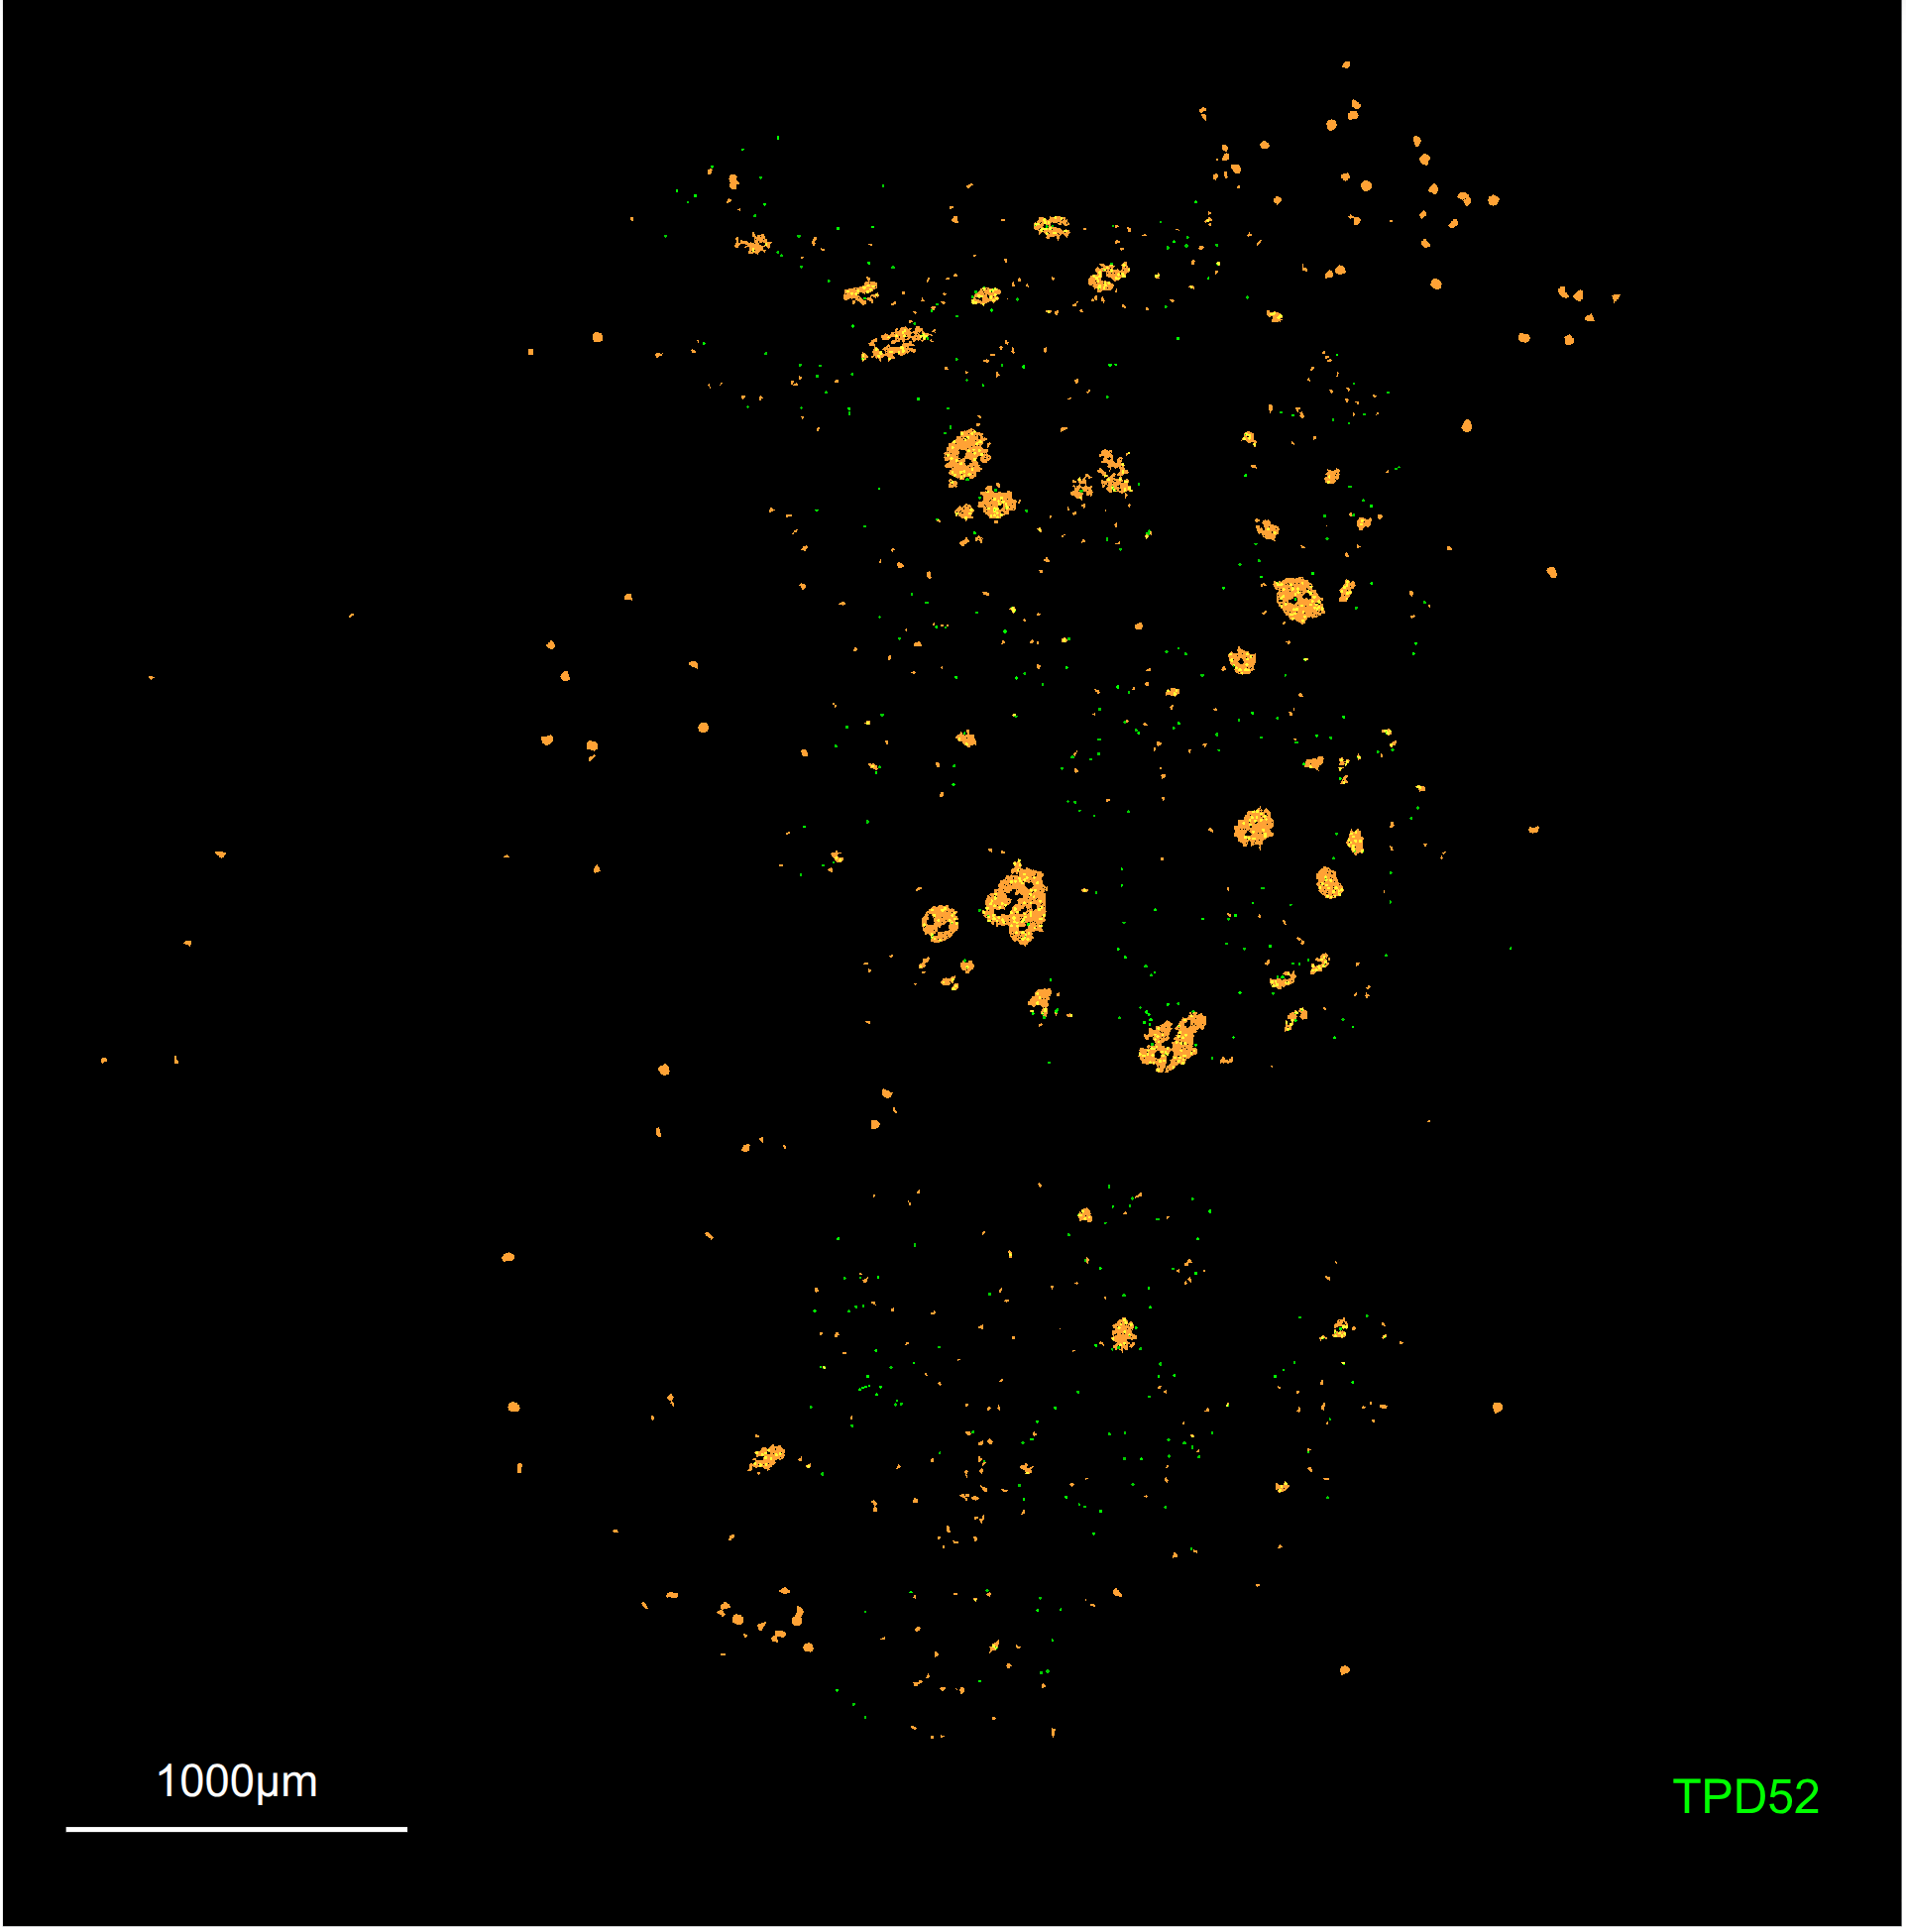
Users can access this feature under Configure, annotate, measure, & more -> Measure/overlay -> Differential gene expression for overlay. As an example, computing the differential expression for genes associated with leiden clustering:
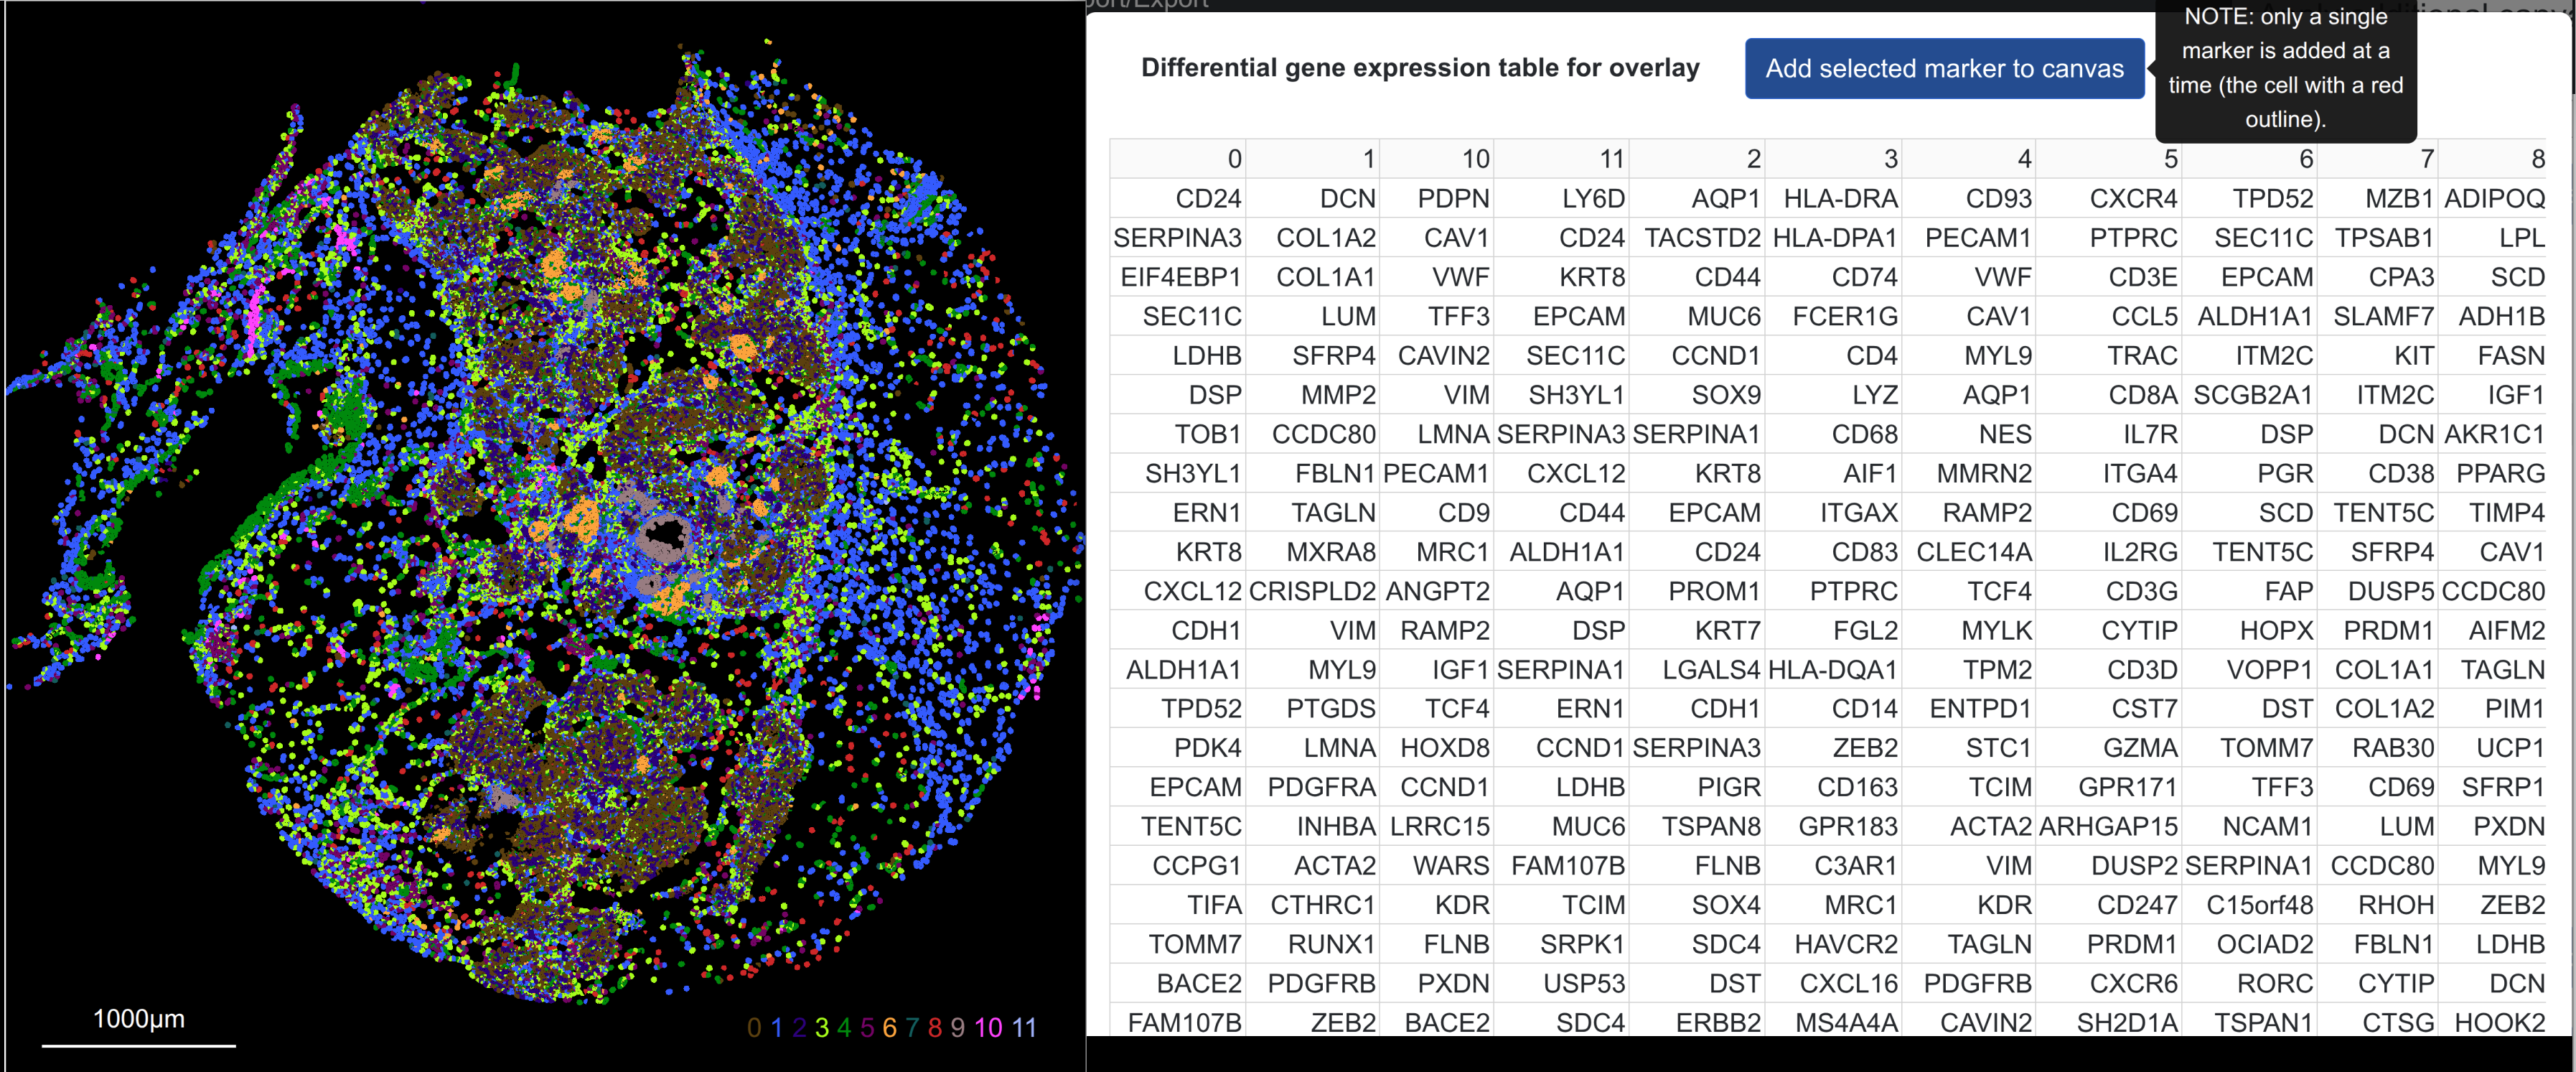
Allows for selection of top expressed genes associated with one or more clusters. From the table, individual genes can be selected by table cell and added to the canvas blend using Add selected marker to canvas (NOTE: only a single marker can be selected in the table and added at once). This allows for cluster-specific markers to be visualized alongside mask overlays, such as a gene (green) associated with cluster 6 (orange):
Switching the categorical overlay applied till cause the DGE table to be re-computed when it is opened.
Switching between ROIs that have the same overlay applied currently does not trigger a re-rendering of the DGE table, although it should. This will be fixed in future versions of Rakaia. In the meantime, users should manually toggle on and off the desired overlay when switching between ROIs to trigger a re-computation.
Processing and filtering considerations
When users are filtering or performing some preprocessing of the spatial data assays above where cells and/or spatial locations are removed, special care should be taken that the other slots in the spatialdata object such as mask polygons, etc. are also filtered to match the expression data. While Rakaia does explicitly check for this when parsing from zarr directories, users should perform these additional checks to ensure that all data slots in a spatialdata object remain aligned.
As an example, with 10x Xenium, filtering out cells with low cell counts causes a mismatch between the cell-level probe counts in sdata.tables['table'] and sdata.shapes['cell_boundaries']. The following code snippet helps to ensure that these remain matched:
expr = sdata.tables['table']
cells = sdata.shapes['cell_boundaries']

# filter out cells with fewer than 25 probe counts
# Compute total counts per cell
total_counts = np.array(expr.X.sum(axis=1)).flatten()

# Subset AnnData (keep cells with >= 25 counts)
expr = expr[total_counts >= 25].copy()

# retain cells only in the new expression data
cells = cells.loc[cells.index.isin(expr.obs['cell_id'])]

sdata.tables['table'] = expr
sdata.shapes['cell_boundaries'] = cells
Other spatial datasets
Creating spatial anndata objects
Creating spatial Anndata objects from spatial data from scratch allows users to construct spatial datasets with spatial expression summarized by cell centroid or spot centroid. in order to do this, the following Anndata slots must be populated:
- The
Xslot with spatial expression summarized at the spot or cell centroid level, where rows are cells/spots, and columns are marker/gene values summarized at that centroid - The
obsmslot must have aspatialkey, and.obsm['spatial]must contain a two-column numpy array of cell or spot spatial coordiates. The first column should correspond to thexdimension, and the secondy. - The
var_namesslot should be a list of the channel names, either gene symbols or string identifiers. IMPORTANT: These names should be unique.
An example of parsing this dataset: https://zenodo.org/records/12682727 into several .h5ad Anndata files is shown below. This sample assumes that one of the ZIP directories is downloaded and unpacked; each directory contains expression and cell centroid coordinate information:
import numpy as np
import pandas as pd
import anndata as ad
import glob
import os
import re

input_dir = "input_path_to_TR_Kidney"
files = glob.glob(f"{input_dir}/*.csv")

samples = list(set([re.split(r'\.(?:cell_data|expression)',
        str(os.path.basename(file)))[0] for file in files if 'scgp_annotations' not in str(file)]))

for sample in samples:
    expr = pd.read_csv(f"{input_dir}/{sample}.expression.csv")
    spatial_coords = pd.read_csv(f"{input_dir}/{sample}.cell_data.csv")

    adata = ad.AnnData(X = expr.to_numpy().astype(np.float32),
                       obsm={'spatial': spatial_coords[['X', 'Y']].to_numpy()})
    adata.var_names = expr.columns
    adata.write_h5ad(f"{input_dir}/{sample}.h5ad")
Additional spatial technologies (squidpy)
Additional spatial technologies may be inherently supported in rakaia provided that they follow the input data format as described above (minimally, that spatial coordinates for pixel locations are provided in spatial array in the obs slot).
Additional examples of spatial datasets that can be rendered in rakaia include the following from the squidpy spatial technology tutorials:
-
Vizgen: https://squidpy.readthedocs.io/en/stable/notebooks/tutorials/tutorial_vizgen.html
-
4i: https://squidpy.readthedocs.io/en/stable/notebooks/tutorials/tutorial_fouri.html
-
Slide-seq: https://squidpy.readthedocs.io/en/stable/notebooks/tutorials/tutorial_slideseqv2.html
For all tutorial datasets above, the data are imported and analyzed in Anndata format, consistent with the required format for rakaia. The adata object referenced in the tutorials can be exported as files with the .h5ad format.
Non-10x spatial assays in spatialdata zarr stores
If rakaia is not able to parse out a 10x compatible assay from the zarr store, by default, it will look for a table in the tables slot with the table key, and import that as an Anndata-formatted object with spatially resolved expression values at x and y coordinates. This is equivalent to the Anndata specified format under Required format. If this named key slot does not exist, then it will inform the user of key error and no data will be imported.
Visualizaton considerations for spatial datasets
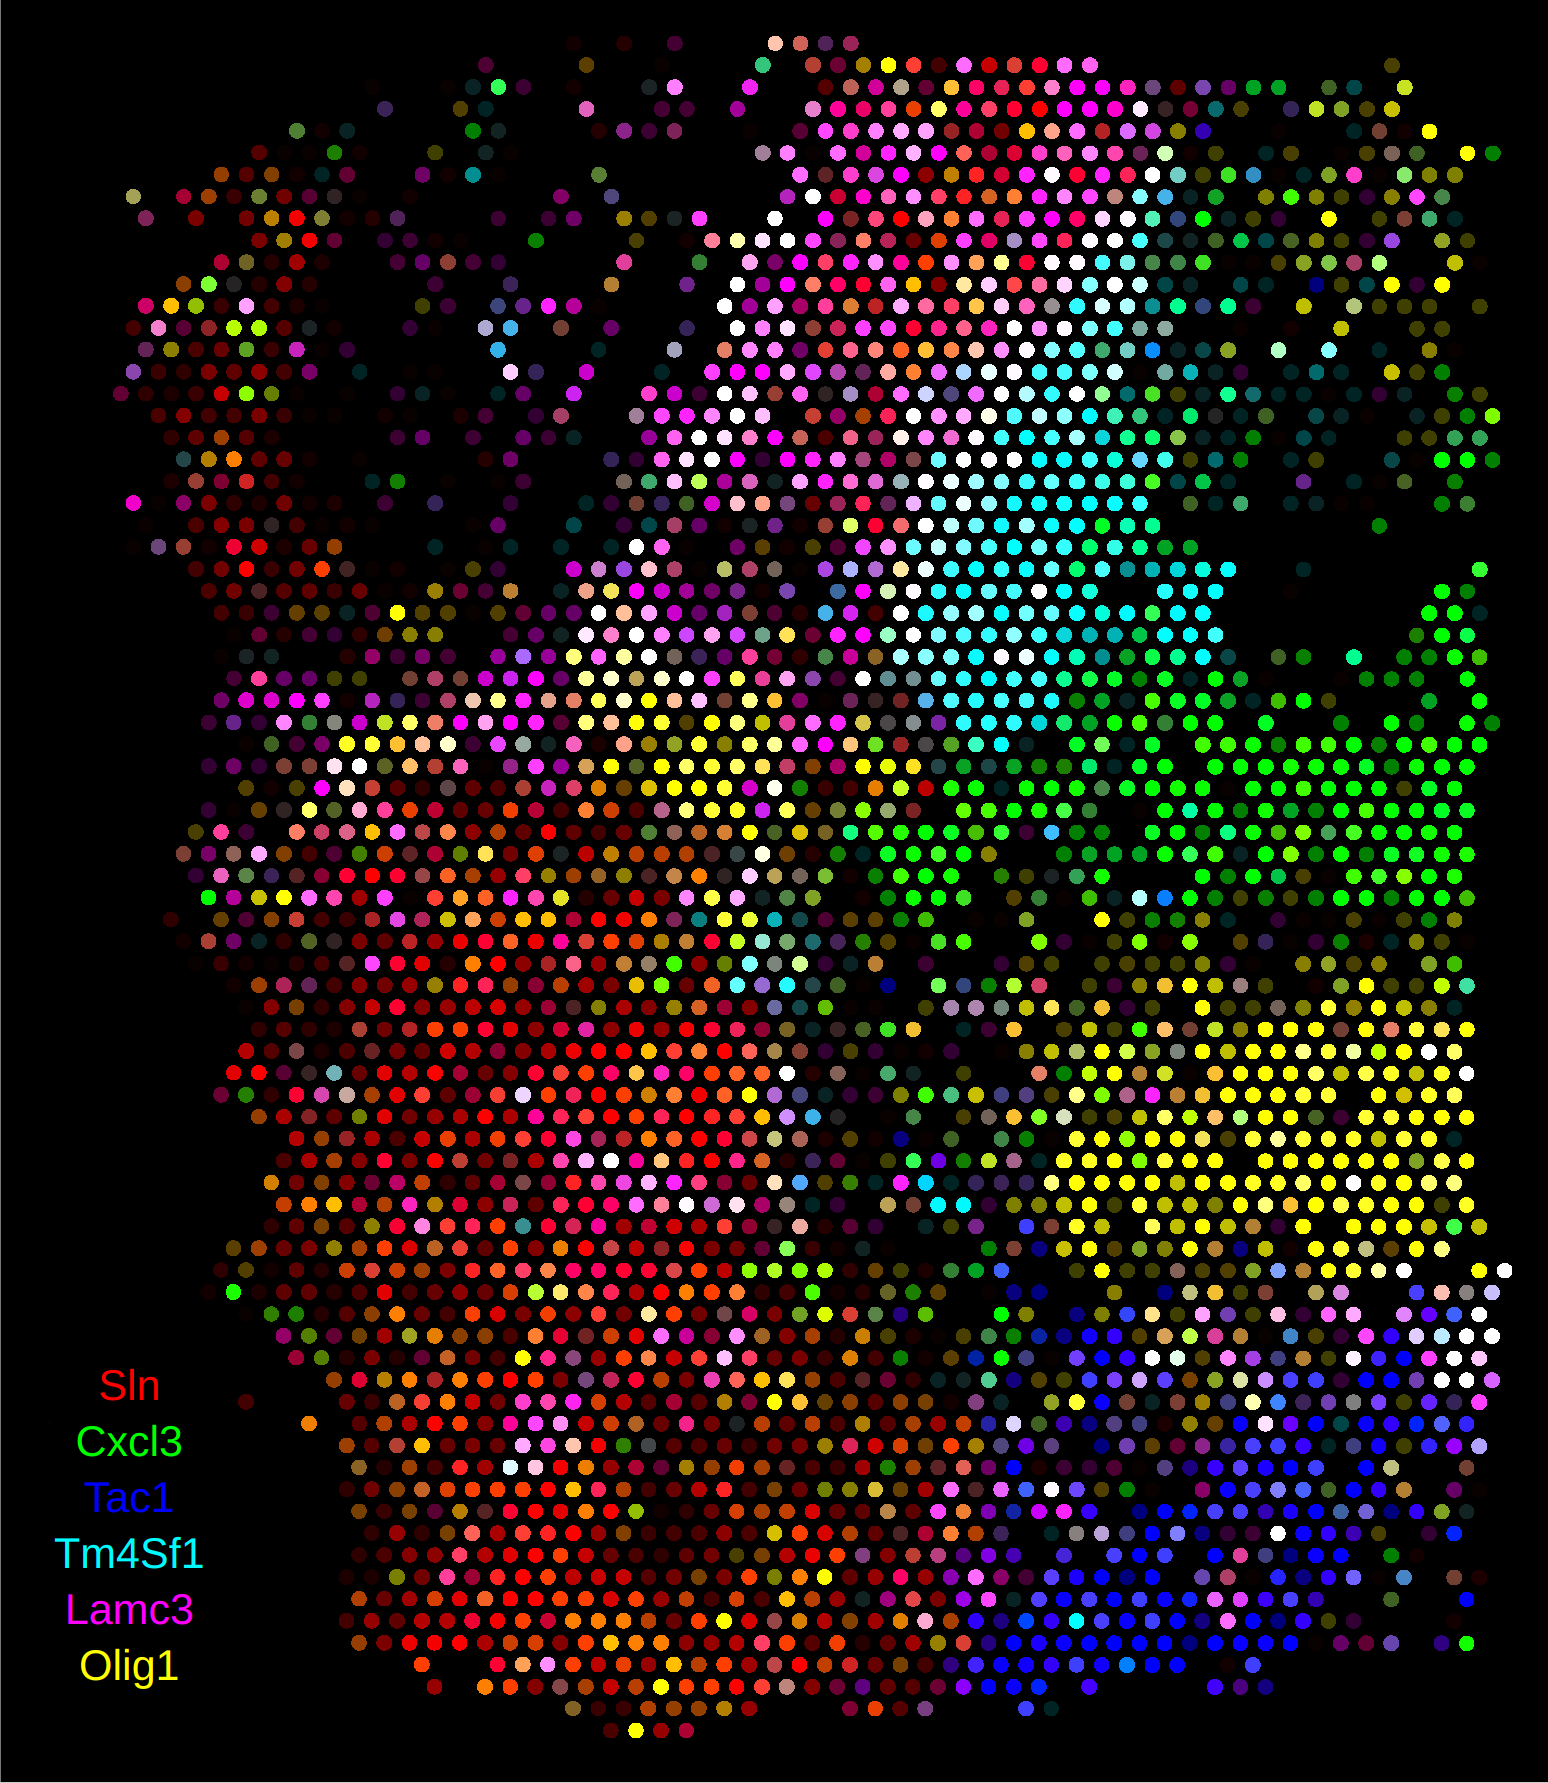
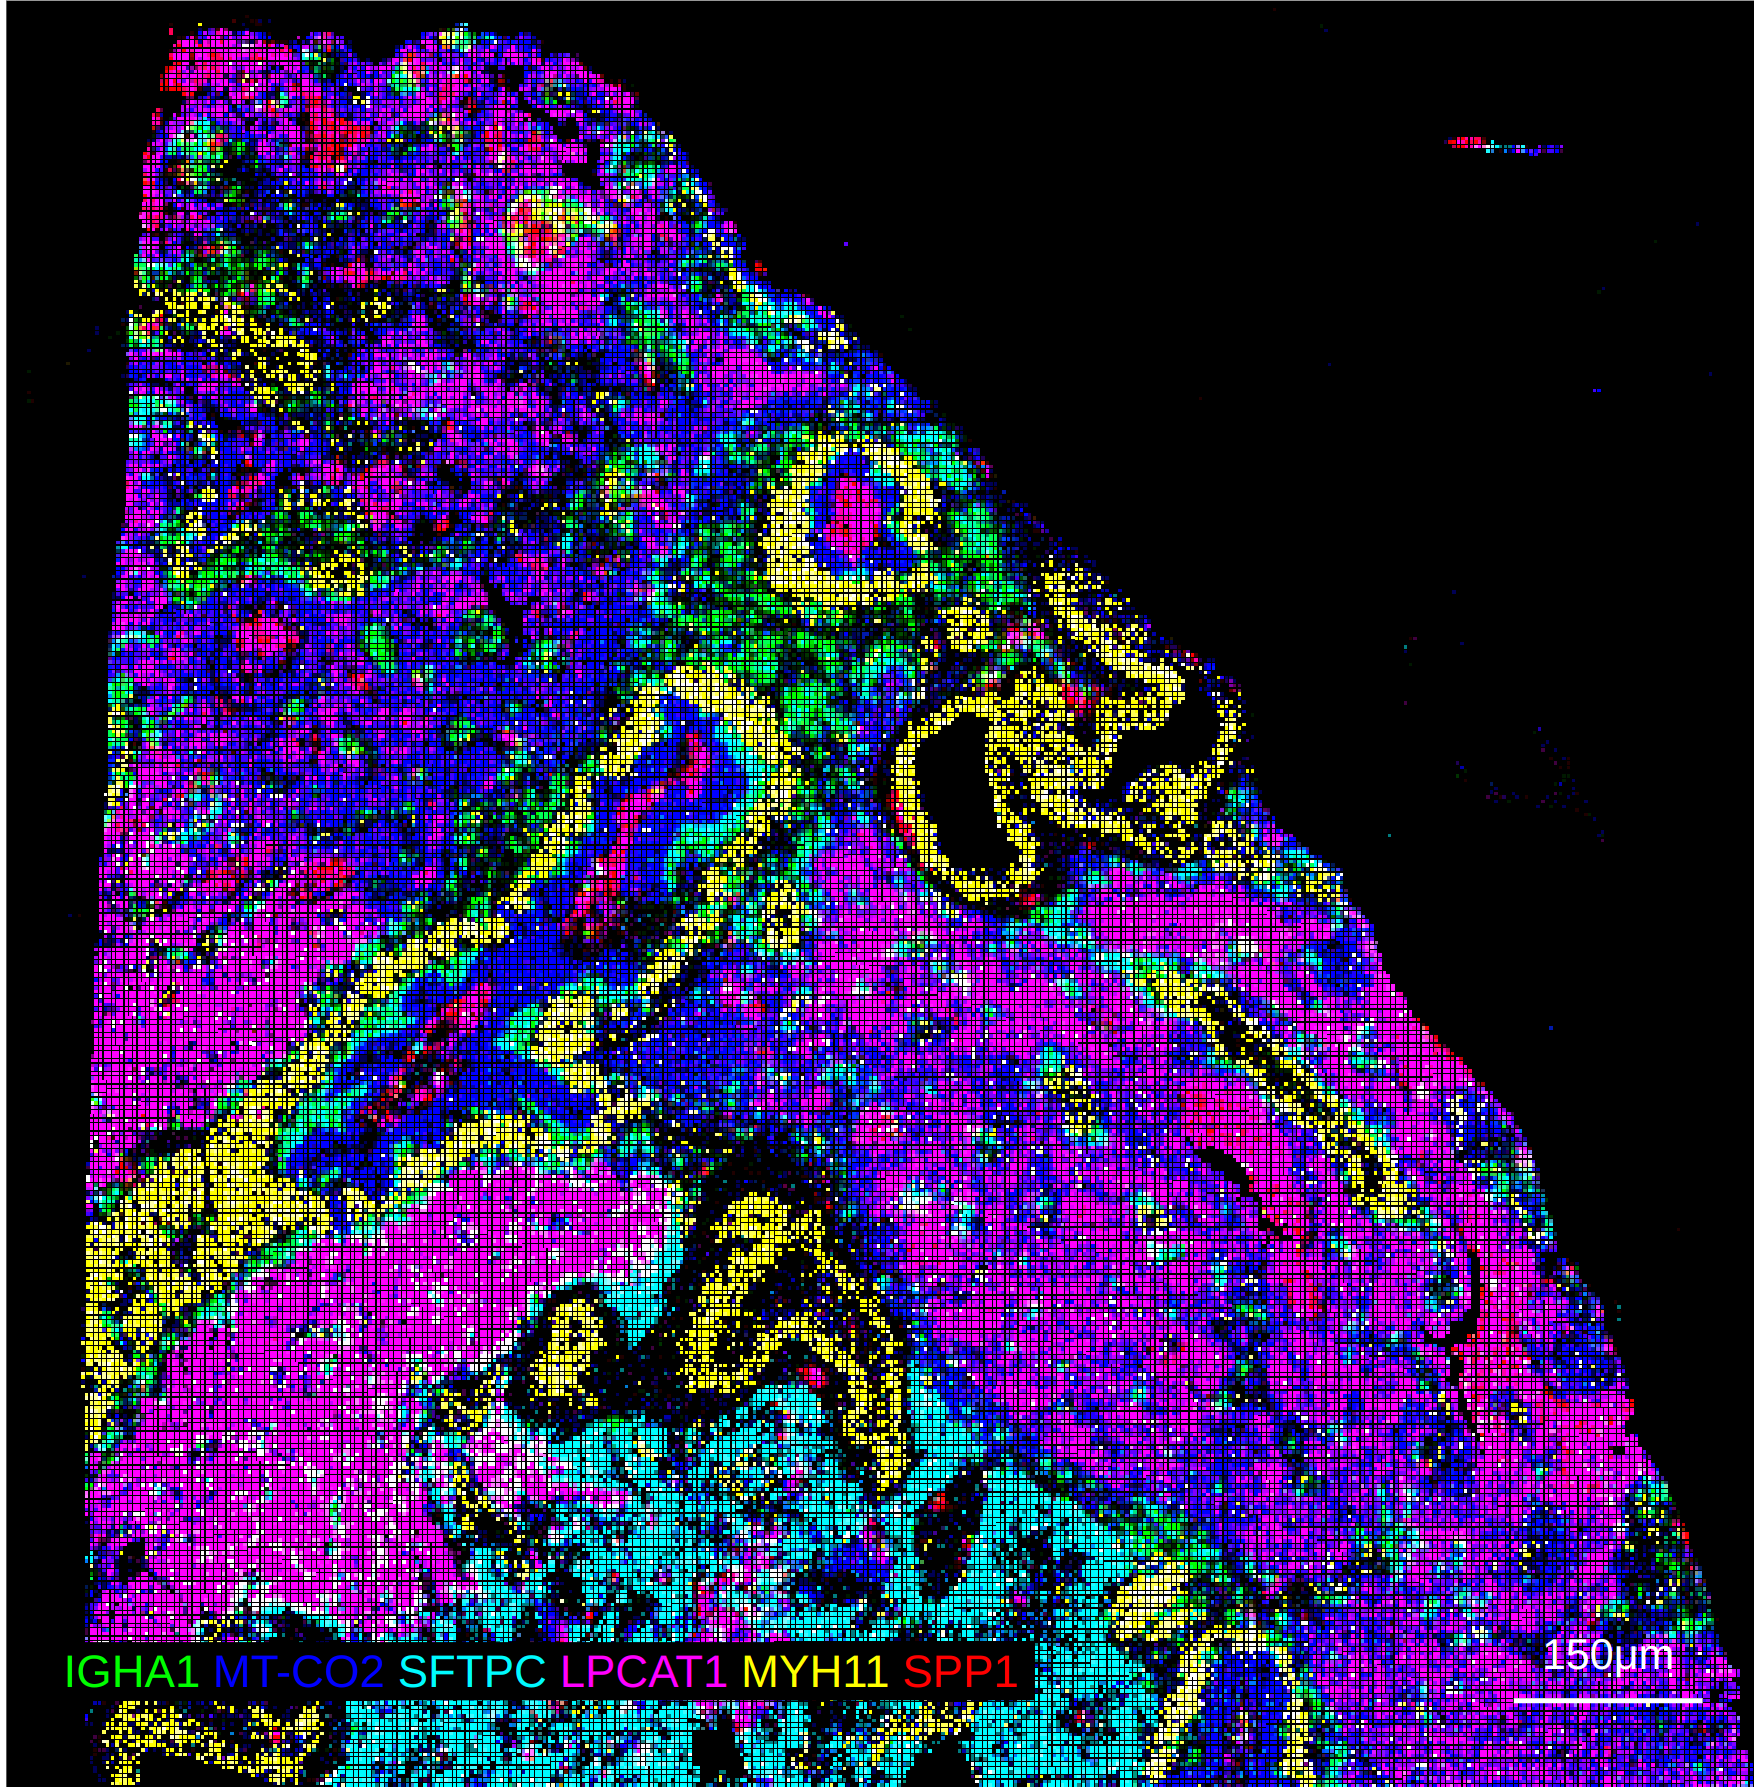
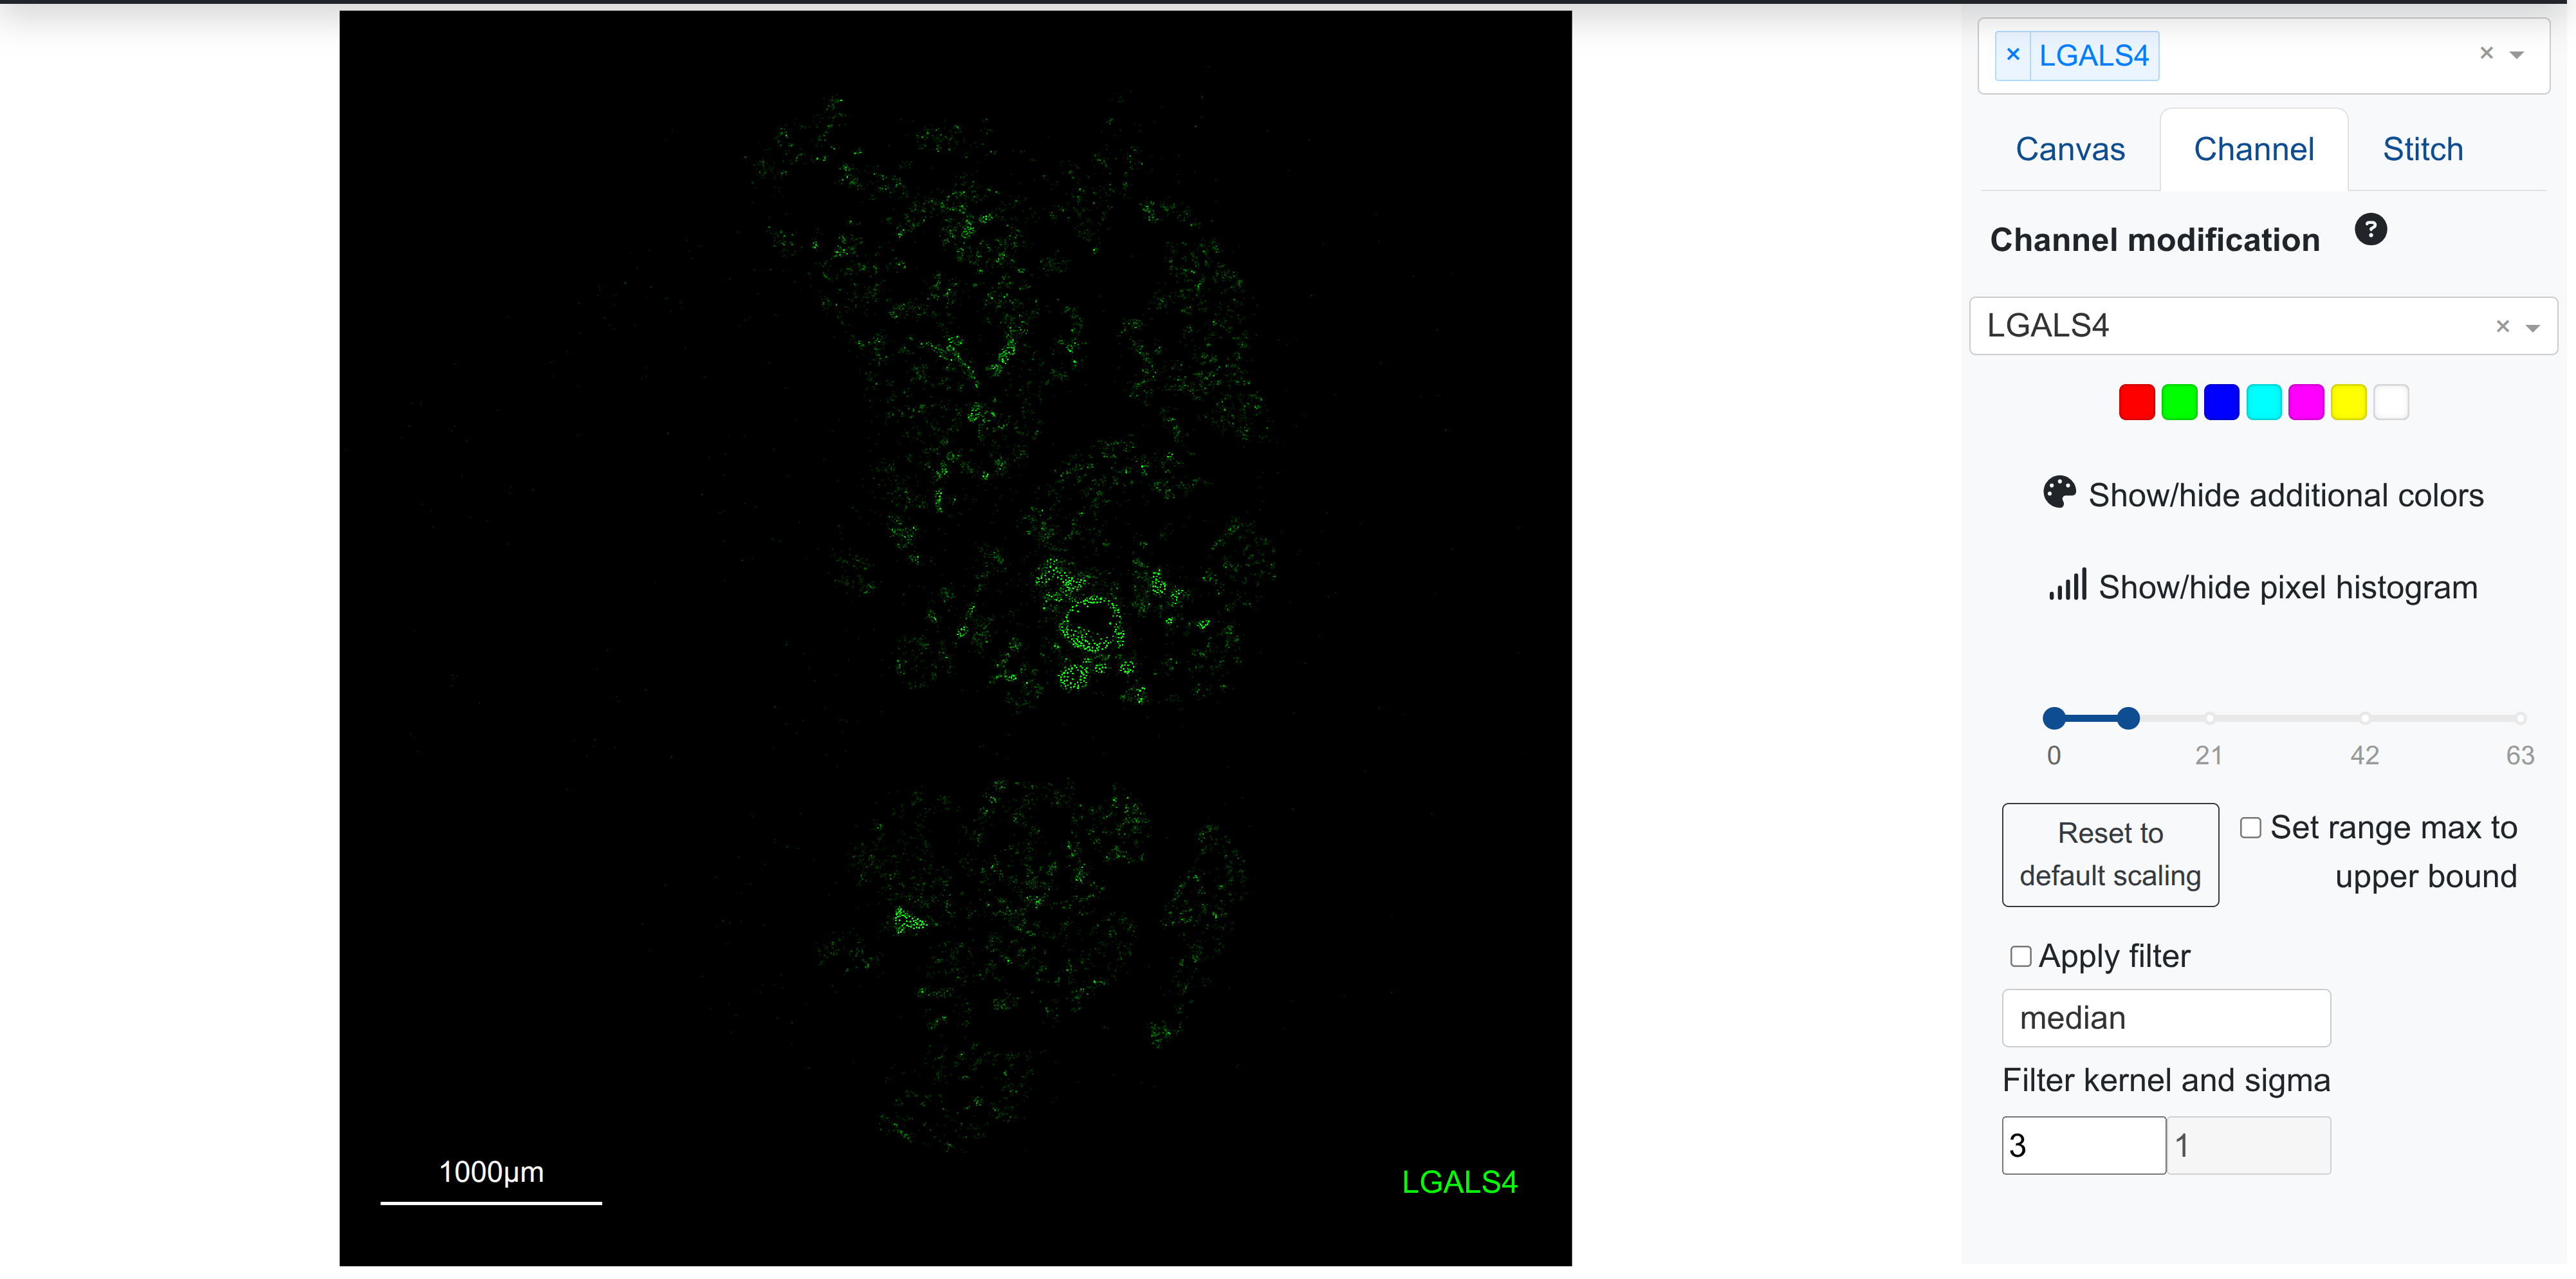
Similar to antibody/imaging-based datasets, spatial datasets can make use of multi-marker blending, scaling, and thresholding to create multiplexed images, where colour blends can show the co-localization of aggregated transcripts by segmented cell or spot. As an example, we can see below the spatial resolution of two transcripts together:
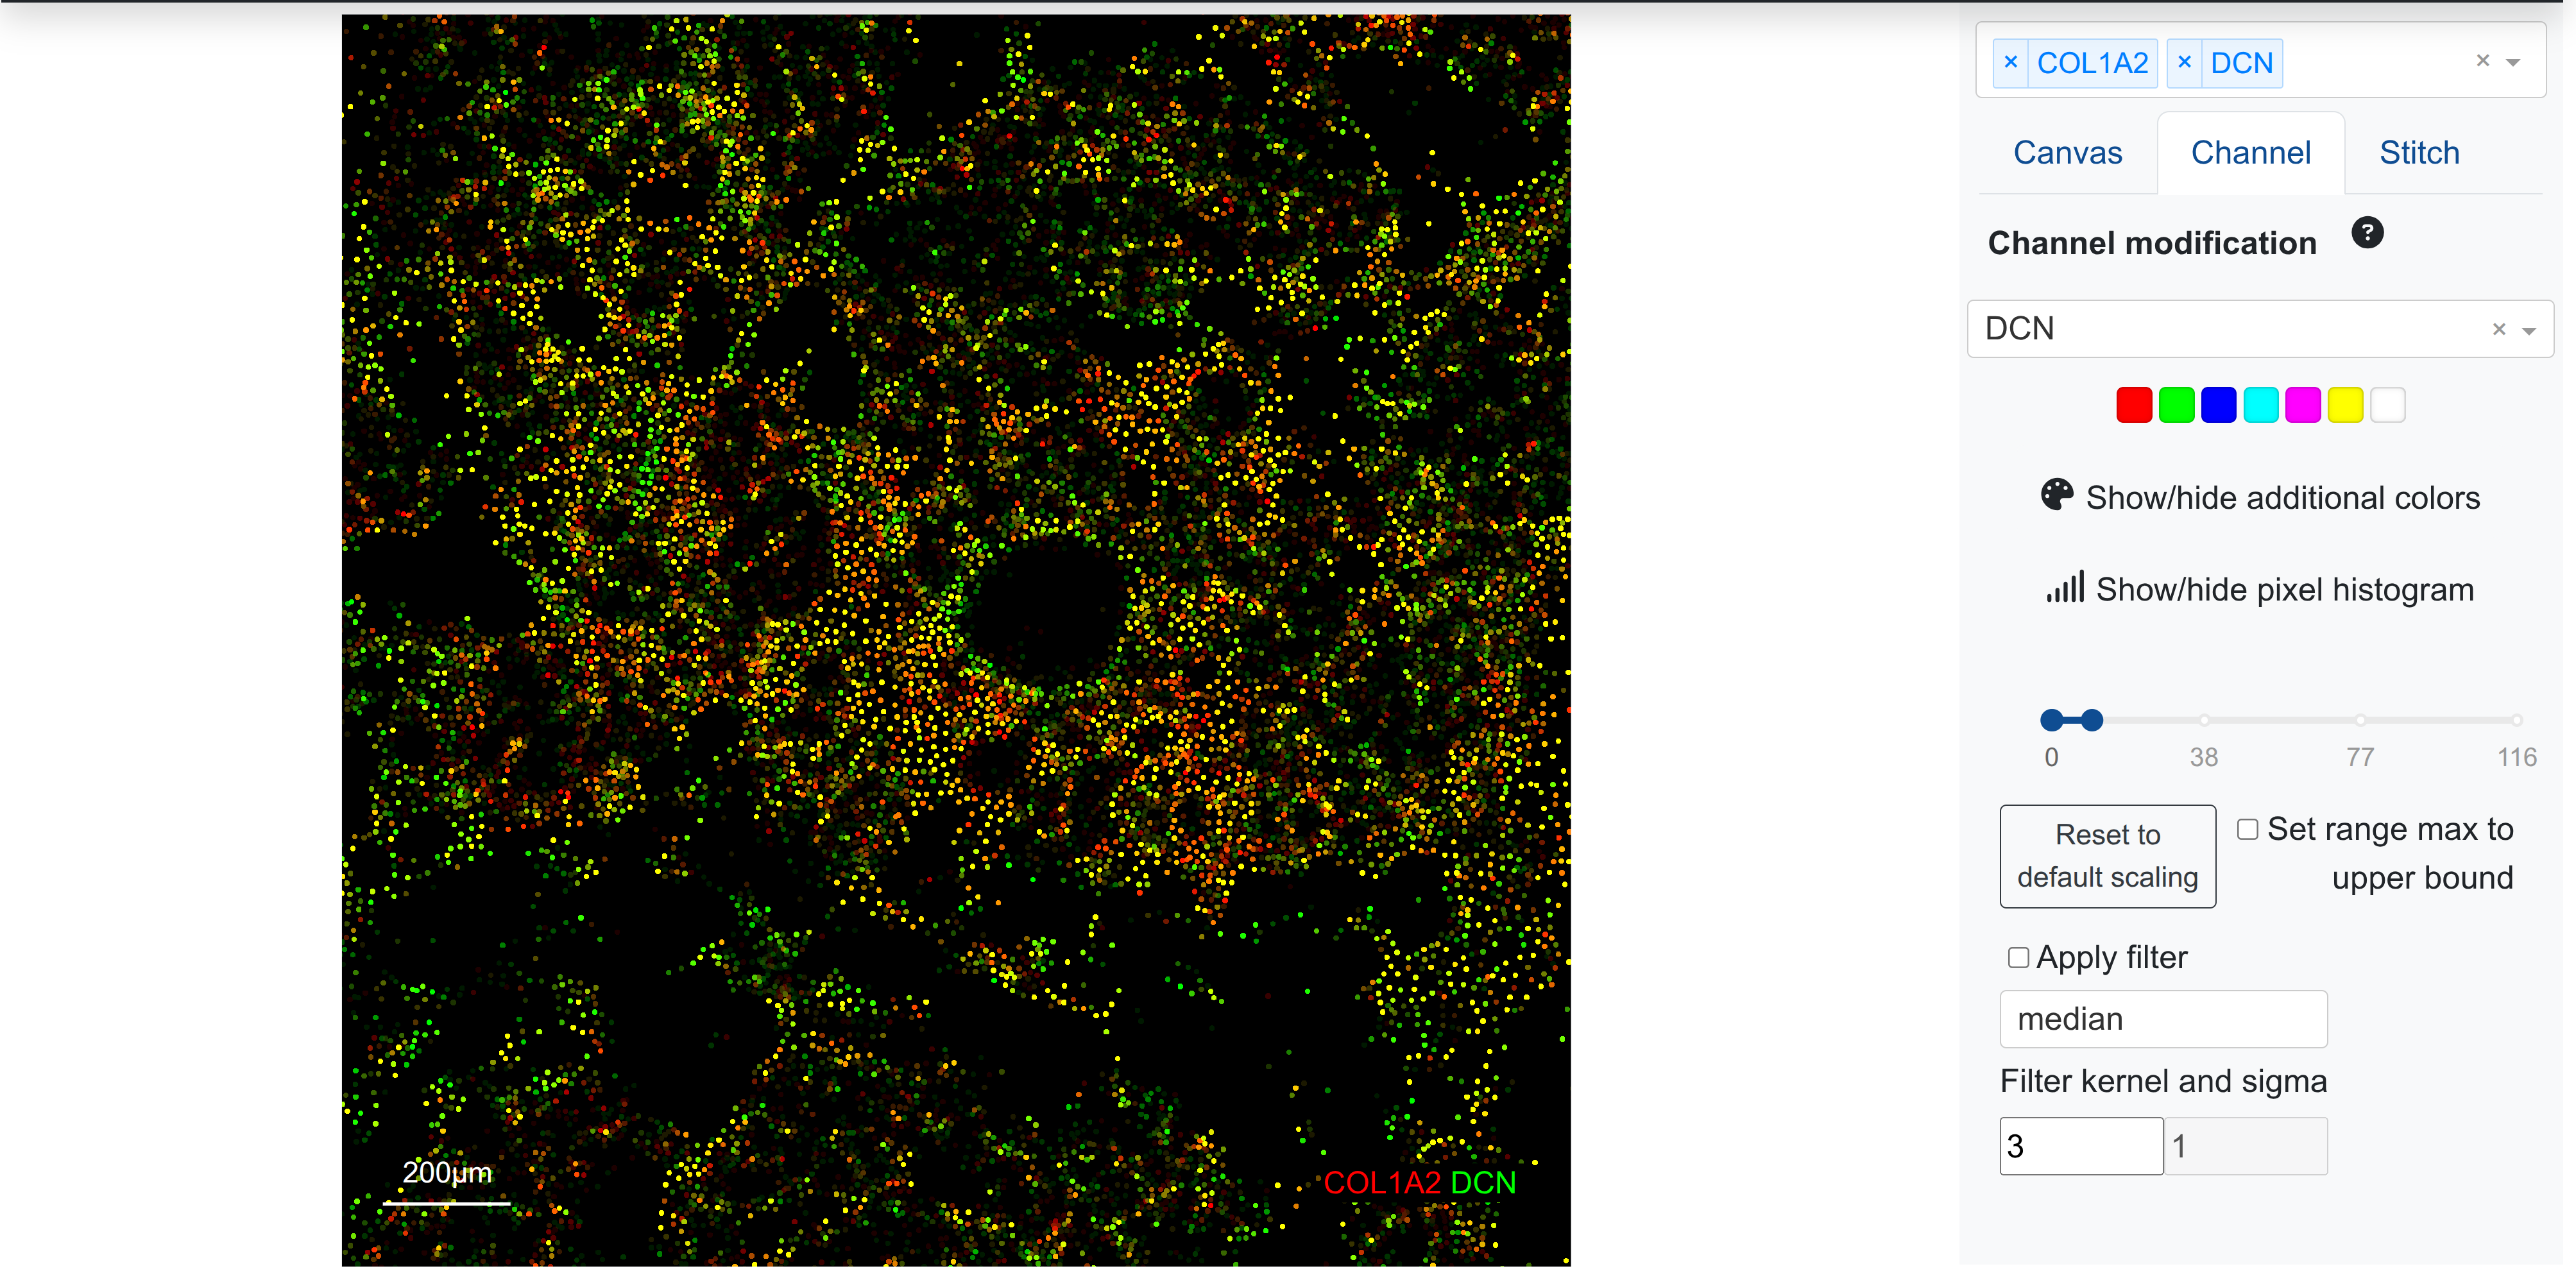
Cell locations with yellow indicate transcript coexpression in the cell, whereas either red or green indicates cells expressing just one of the transcripts, respectively. Using the range slider in the channel sidebar (right), it is also possible to show more of a transcript gradient by modifying the upper and lower bound on marker intensity, which is a common visualisation step for highly multiplexed images. Visit the article on pixel level analysis for more information.
Due to the sparsity of many Anndata and zarr-formatted datasets, the upper bound threshold for visually scaling a marker may often be quite low (1-2), causing more visual saturation of the signal as compared to dense images such as proteomics or IF. Users may wish to indicate the transcript gradient by modifying the default upper bound to a higher value, thereby reducing visual saturation.
As an example, the following marker in pancreas gets a default upper scaling value of 1 (notice the placement of the upper bound in the scale slider on the right), giving higher visual saturation in cells with lower transcript counts:
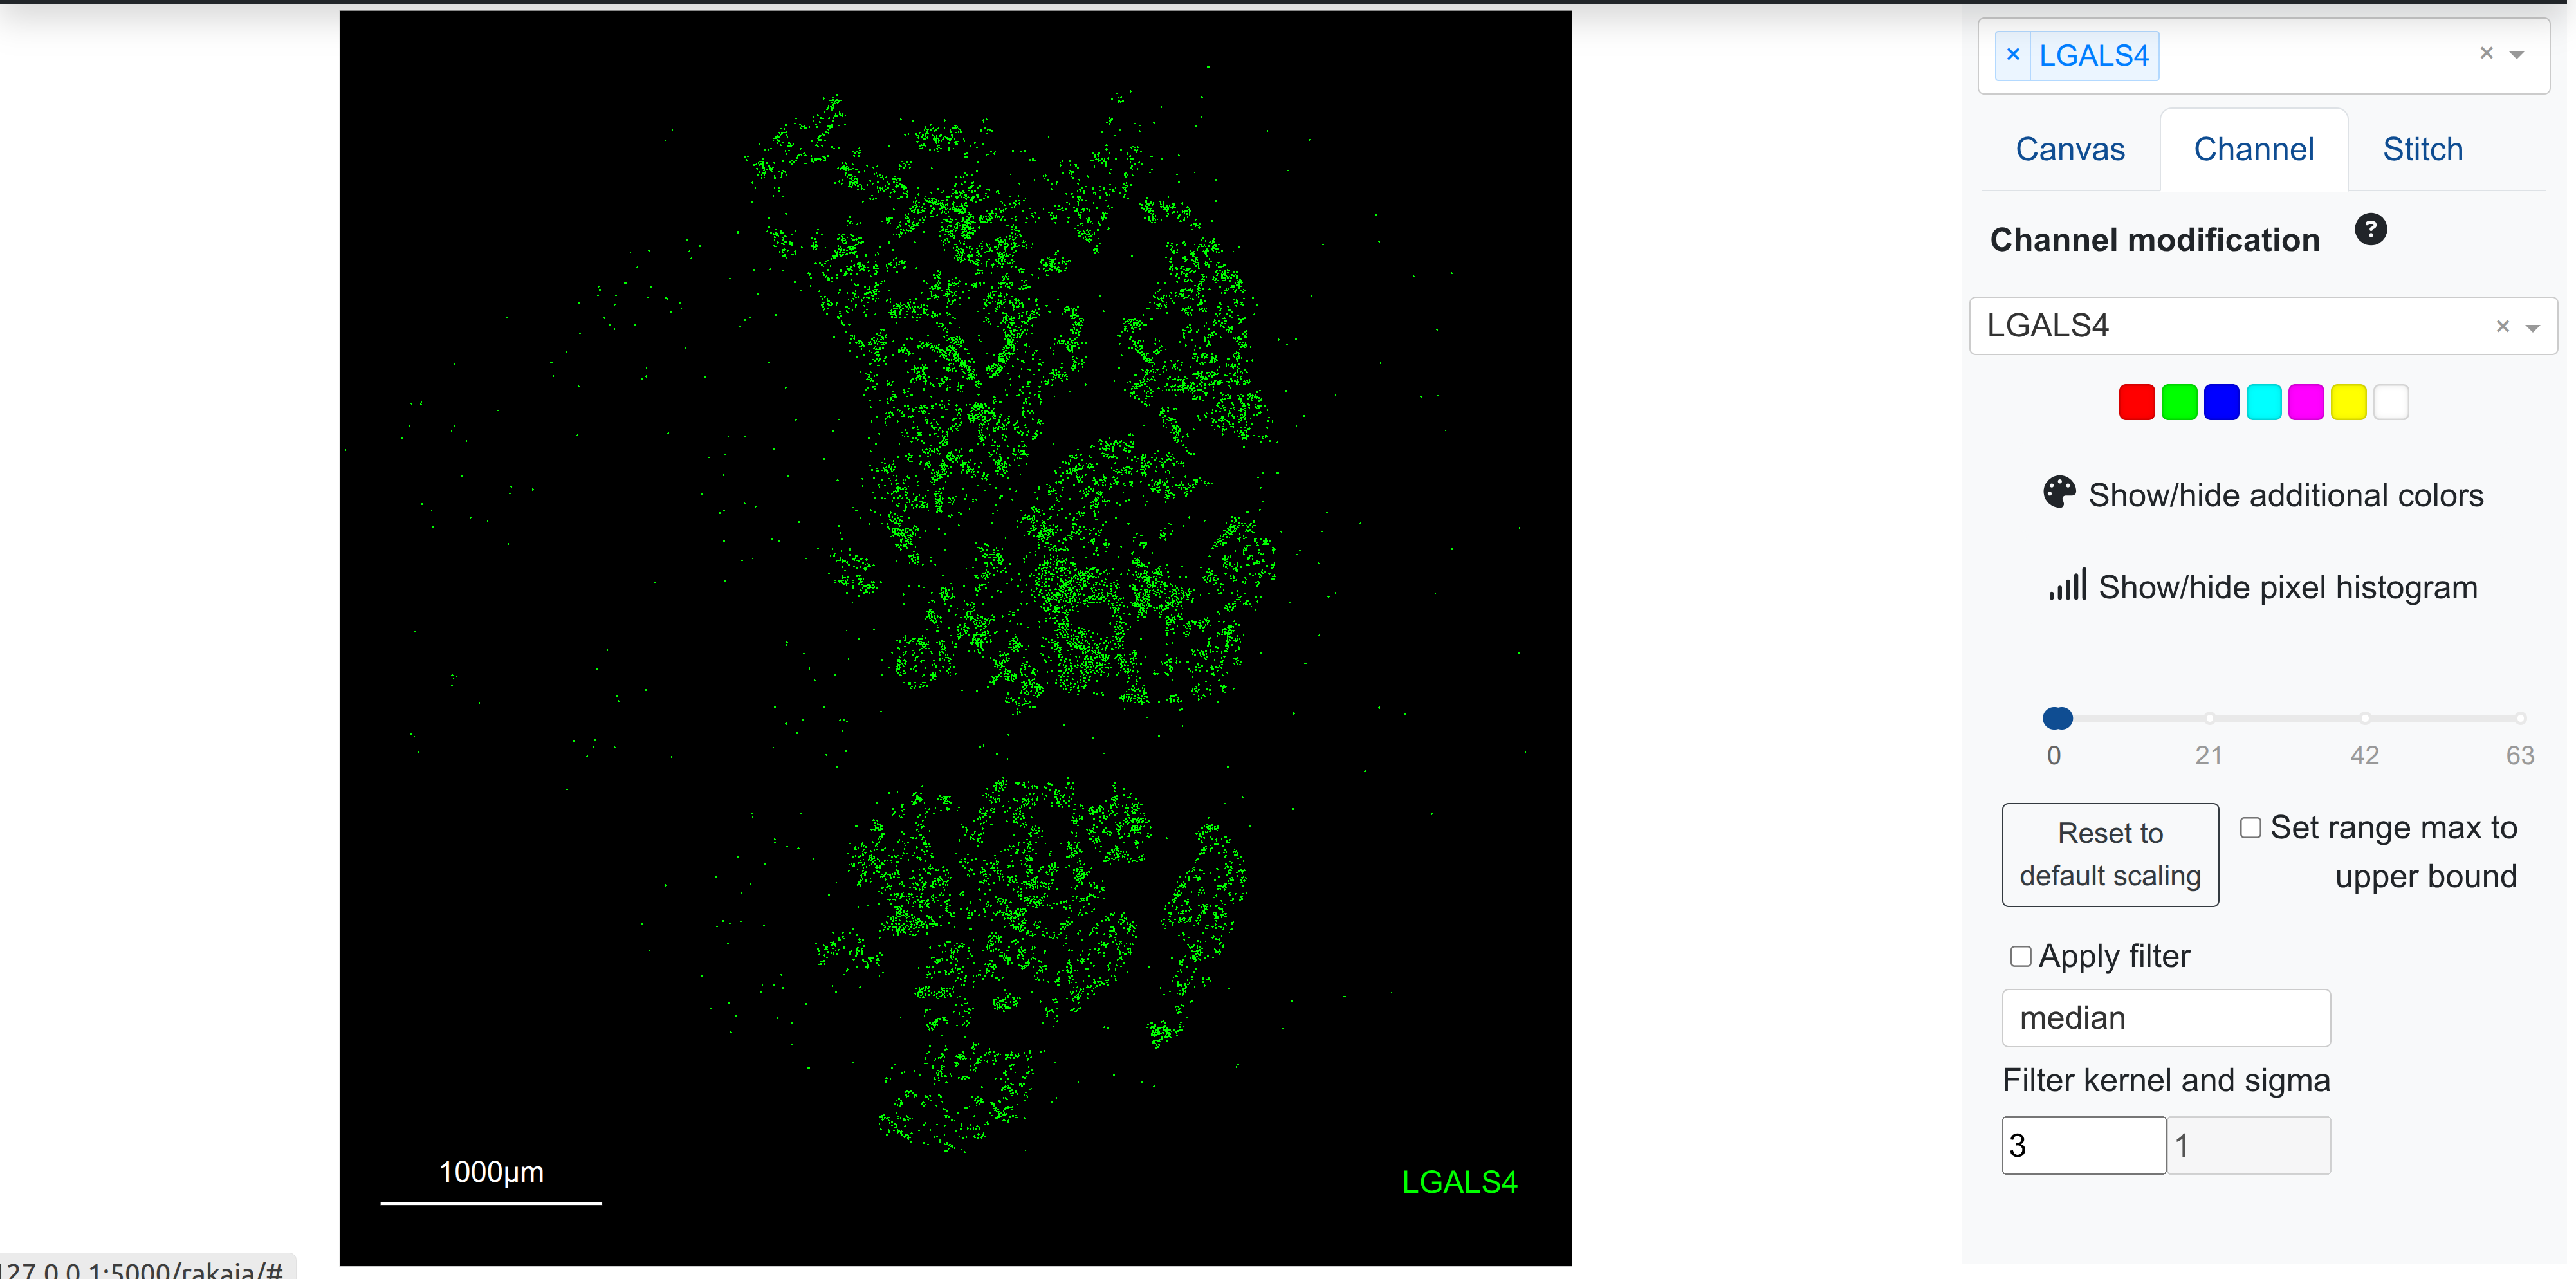
However, adjusting the upper bound slider to a larger value decreases the visual saturation intensity, better revealing the expression gradient based on morphology:
Users should take care to evaluate the visual gradients for blended markers to ensure that the scaling thresholds set are representative of the biological signal expected and seen.
rakaia features not available to spatial datasets�
Spatial datasets have orders of magnitude more variables and markers than IMC datasets (tens of thousands of markers as opposed to 40-50 antibodies), so the lazy loading features behave differently for these technologies. This means that certain features that can be applied to an entire ROI for IMC cannot be used for spatial analysis due to memory and time constraints in processing all dataset markers:
- The channel/marker tile gallery is not supported for as generating a thumbnail preview for thousands of markers would be prohibitively time-consuming
- Both marker correlation and in-app marker quantification can be performed only on markers that are in the current canvas, as these are the only variables that have been loaded into memory at a given point in analysis
Troubleshooting
Minimum package versioning
To ensure that zarr stores can be read reliably by rakaia, and to avoid any backwards incompatibility issues with zarr data encodings, users should use the following packages or newer when generating zarr directories:
anndata==0.11.0
spatial_image==1.2.1
spatialdata==0.4.0
spatialdata-io==0.3.0
spatialdata-plot==0.2.11
xarray==2024.10.0
xarray-dataclasses==1.9.1
xarray-schema==0.0.3
xarray-spatial==0.4.0
This will help to avoid errors such as
anndata._io.specs.registry.IORegistryError: No read method registered for IOSpec(encoding_type='null', encoding_version='0.1.0') from <class 'zarr.core.Array'>. You may need to update your installation of anndata.
which can occur when attempting to read zarr stores that were generated with older package versions.